AcrDB Help Page
What are CRISPR-Cas and anti-CRISPR?
CRISPR-Cas stands for clustered regularly interspaced short palindromic repeats (CRISPR) and CRISPR-associated (Cas) genes. CRISPR-Cas is an adaptive anti-viral immune mechanism, and widely found in ~50% and ~90% of bacterial and archaeal genomes. Anti-CRISPR (Acr) proteins were first discovered in 2013 in Pseudomonas phages and prophages. As of June 2020, 64 experimentally characterized Acr proteins (42 since 2018 and 17 already in 2020) have been published, and most of the them had been identified with the help of bioinformatics. Notably, very little sequence similarity is found between different Acrs, and most of them do not have any conserved Pfam domains and have no homology to known proteins. More information about anti-CRISPRs can be found in AcrFinder webpage.
Application of Anti-CRISPR in genome editing
As the naturally occurring inhibitors of CRISPR-Cas, Acrs have some clear advantages to be a key component of future’s safer and more controllable CRISPR-Cas genome editing tools. These advantages include: (i) Acr is genetically encodable, (ii) there are numerous choices of Acrs with a high diversity and broad spectrum, (iii) different Acrs target different Cas nucleases with diverse sizes, inhabitation strengths, and mechanisms, and (iv) Acrs can be easily integrated into a variety of existing in vivo and in vitro molecular cloning systems. More information can be found in a recent review paper. Since 2017, over 15 cases have already been published, applying Acrs to finely control CRISPR-Cas gene editing, gene regulation, epigenetic modification, DNA imaging, and gene drive, and more will surely happen with acceleratingly more new Acrs being discovered.
Browser Compatiability
| OS | Version | Chrome | Firefox | Microsoft Edge | Safari |
| Linux | Ubuntu 16.04 | 79.0.3945.79 | 71.0 | n/a | n/a |
| MacOS | Catalina | 79.0.3945.88 | 71.0 | n/a | 13.0.2 |
| Windows | 10 | 73.0.3683.86 | 71.0 | 44.18362.449.0 | n/a |
Usage
Follow the steps below to learn how to use AcrDB website and understand the data:
-
Browse database with three entries
There are three ways to browse/search the AcrDB:
(i) browse by Taxonomy.
(ii) search by keywords.
(iii) browse by Cas subtypes (default).
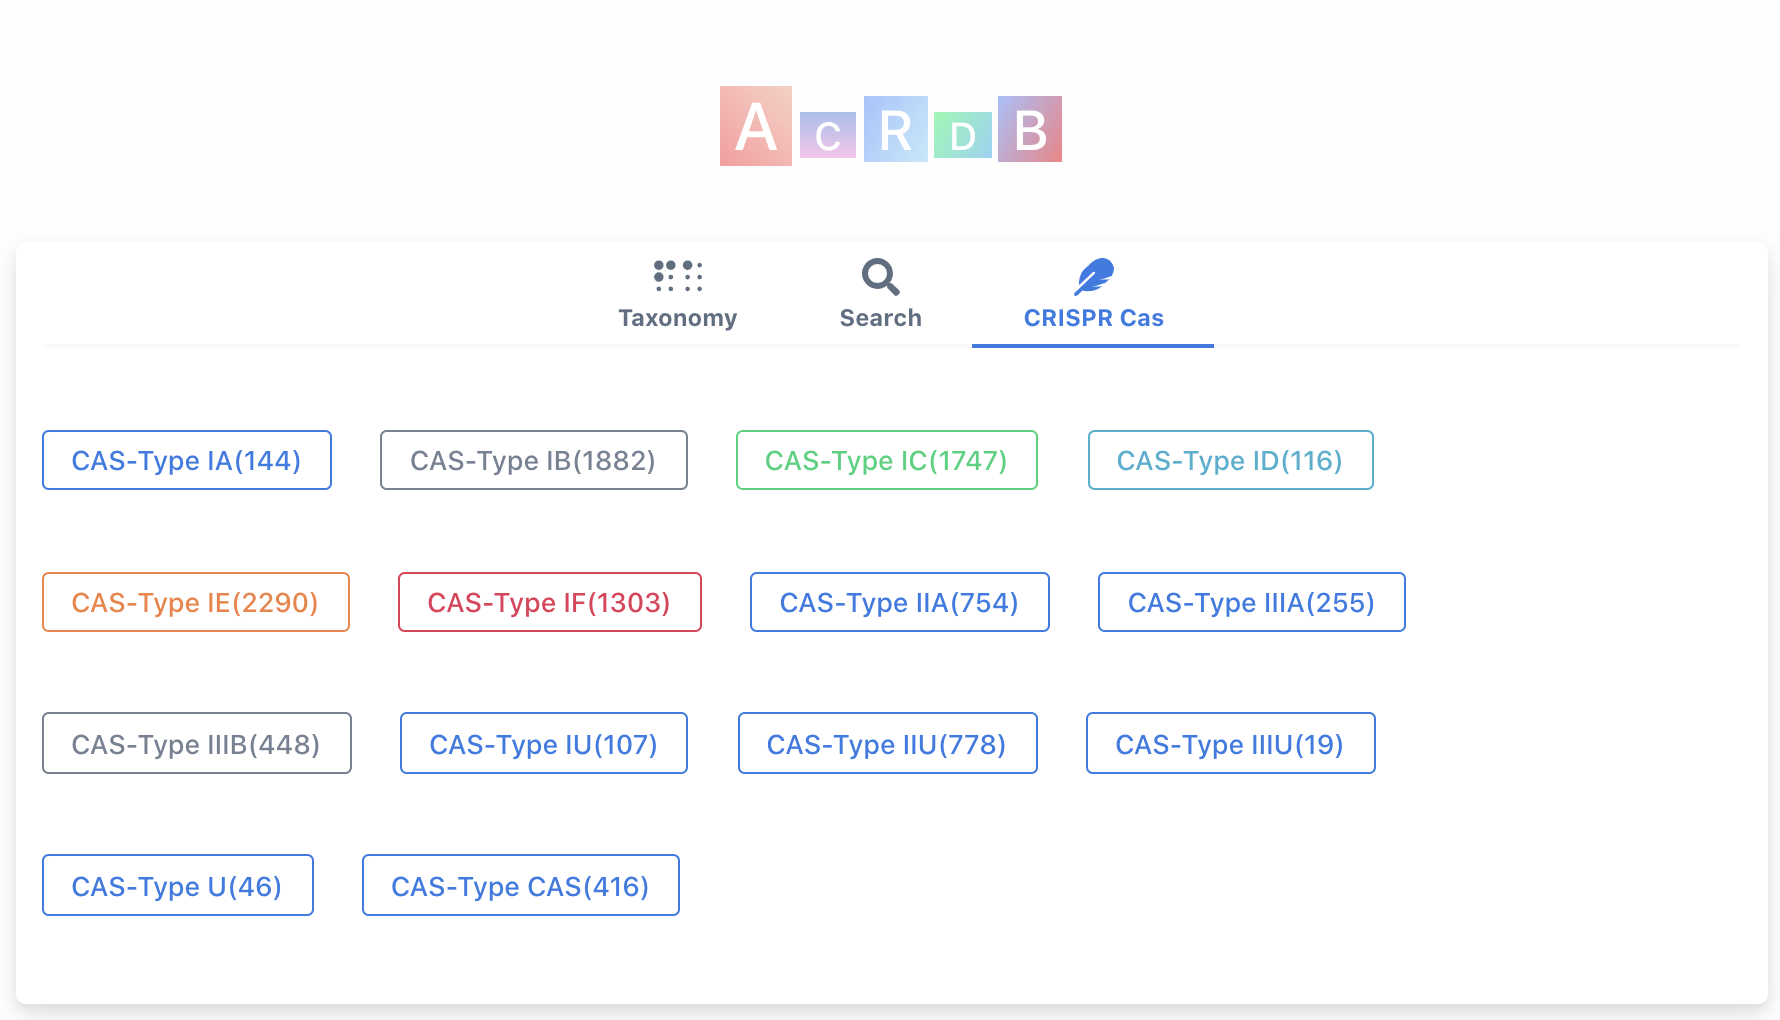
When open the homepage (figure above), the default view is browse by Cas subtypes. The numbers in the parentheses are the numbers of Acr-Aca loci/operons that are found in genomes with Self Targeting Spacers (STSs) (equivalent to guilt-by-association (GBA) medium+high level by AcrFinder). See here to understand the levels.
(i) browse by Taxonomy.
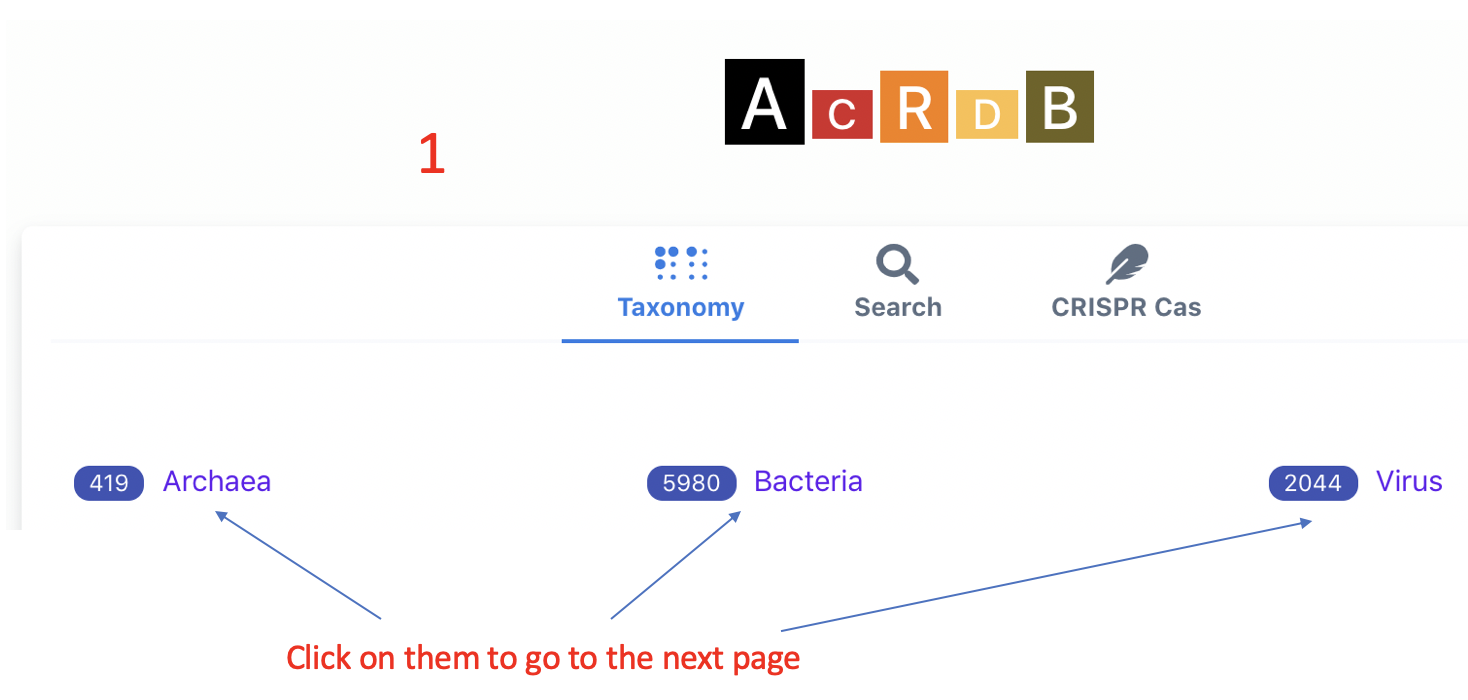
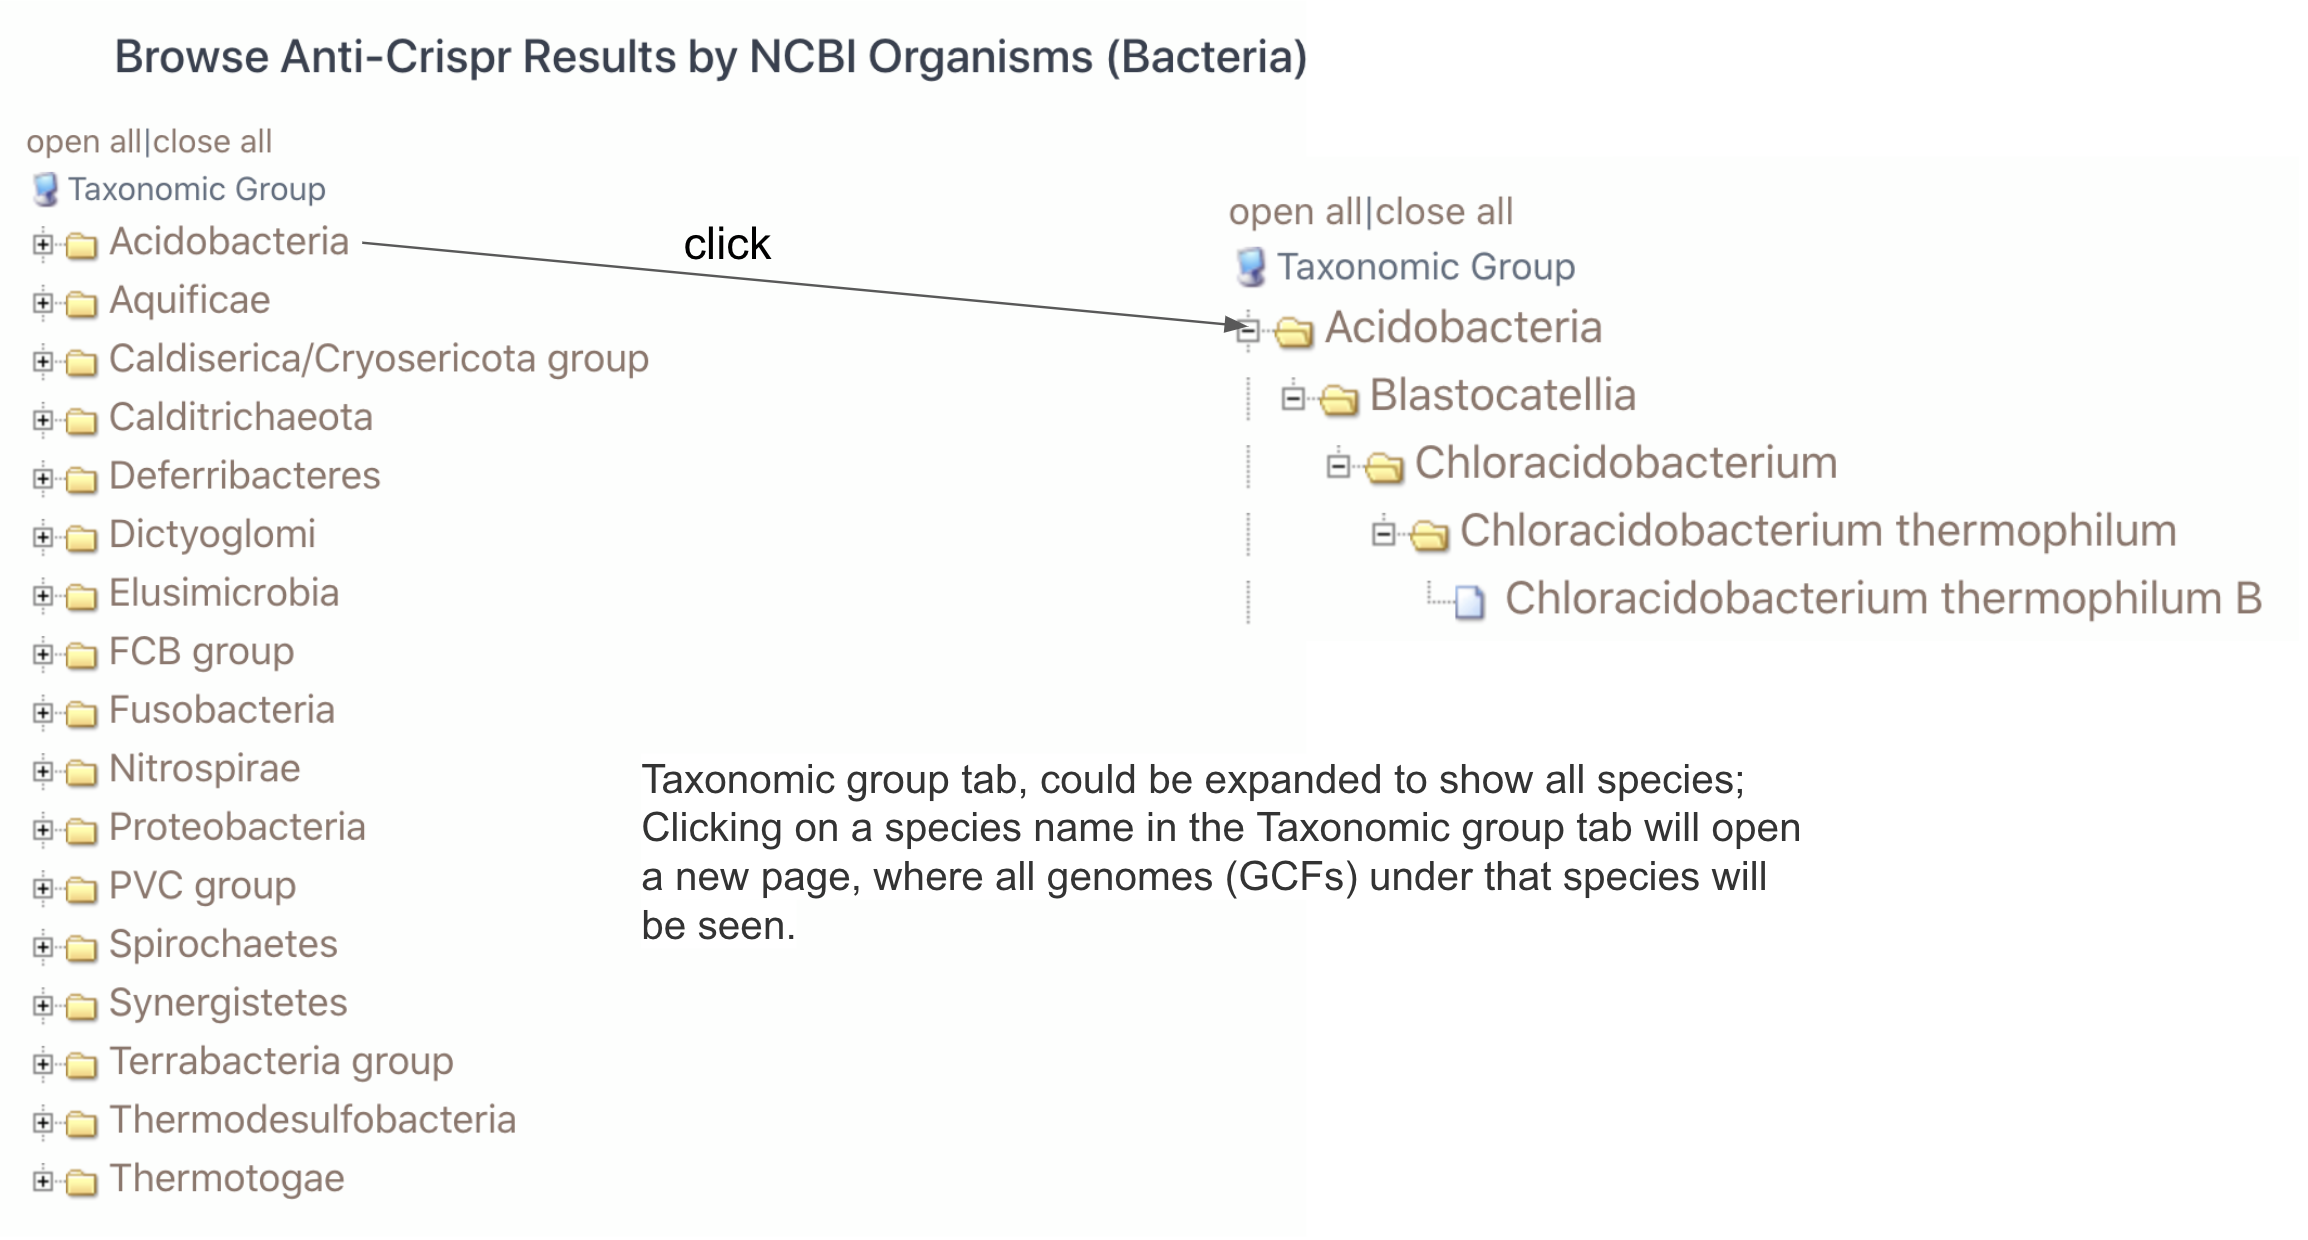
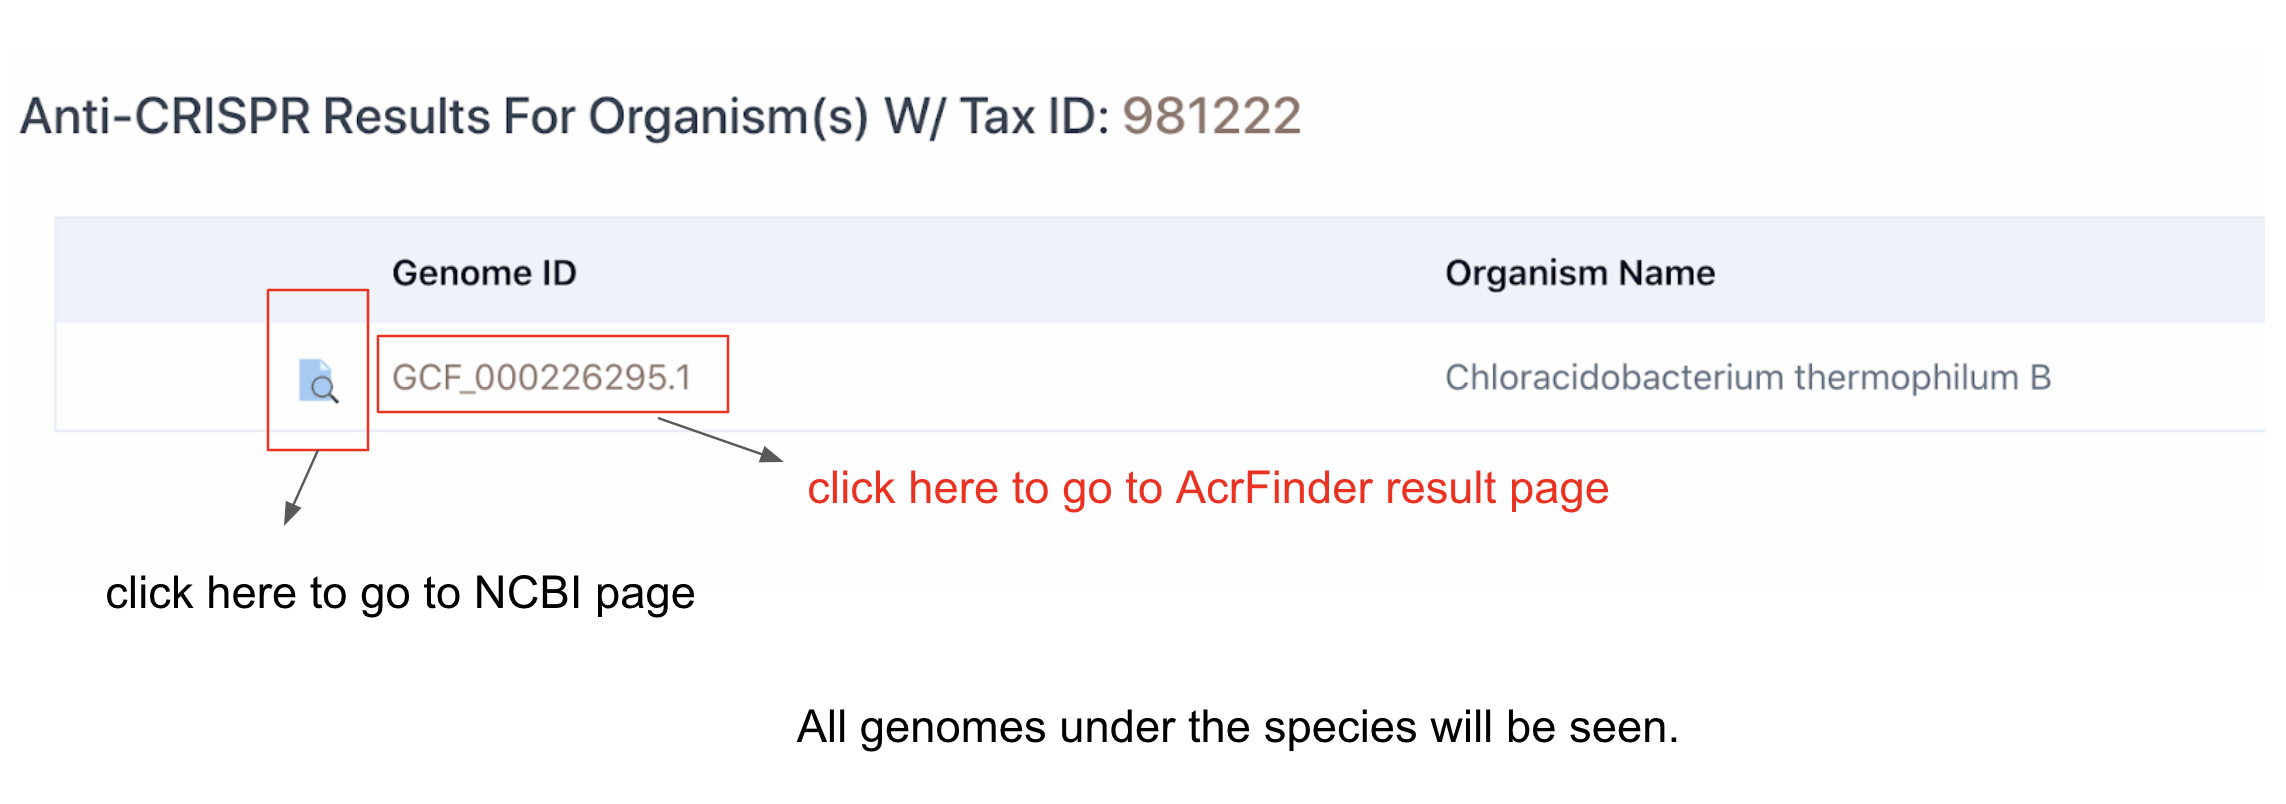
Clicking on Taxonomy tab will allow to choose one of the three taxonomy domains (Archaea, Bacteria and Virus). The numbers in parentheses are the number of RefSeq genomes that are found to have complete CRISPR-Cas systems and Acr-Aca loci (equivalent to GBA low+medium+high by AcrFinder) or Acr homologs for each organism type. Again see here to understand the levels.
(ii) search by keywords.
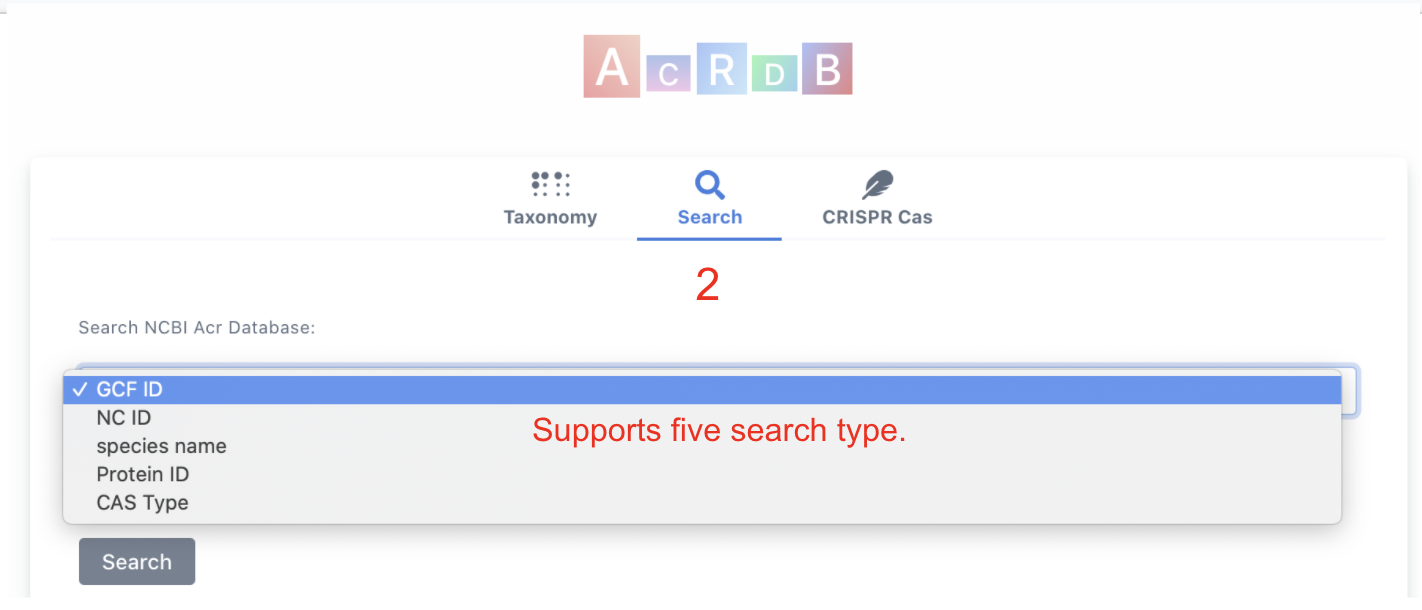
Clicking on Search tab will allow keyword search with five keyword types:
- GCF ID (e.g. GCF_002850575.1)
- NC ID (e.g. NC_019915.1)
- Species Name (e.g. Weeksella virosa)
- Protein ID (e.g. WP_013597345.1)
- CAS Type (e.g. CAS-Type IC)
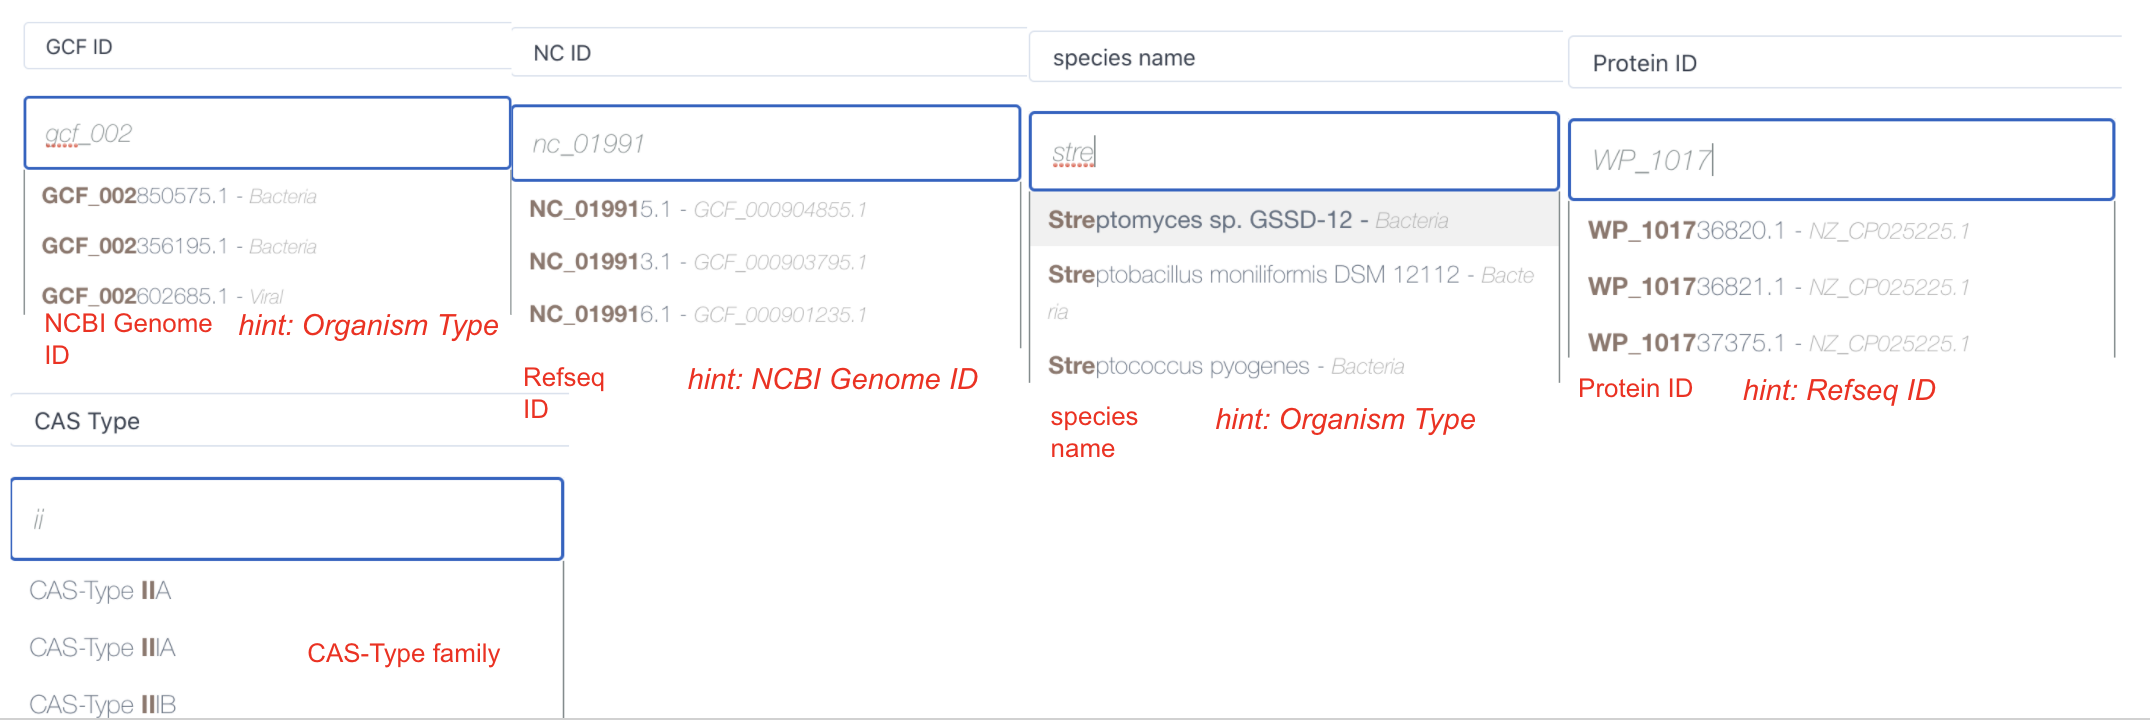
Your inputs can be autocompleted while you are typing the words. Besides, We can match your inputs to its related description in italic font on the right side of the hinted text.
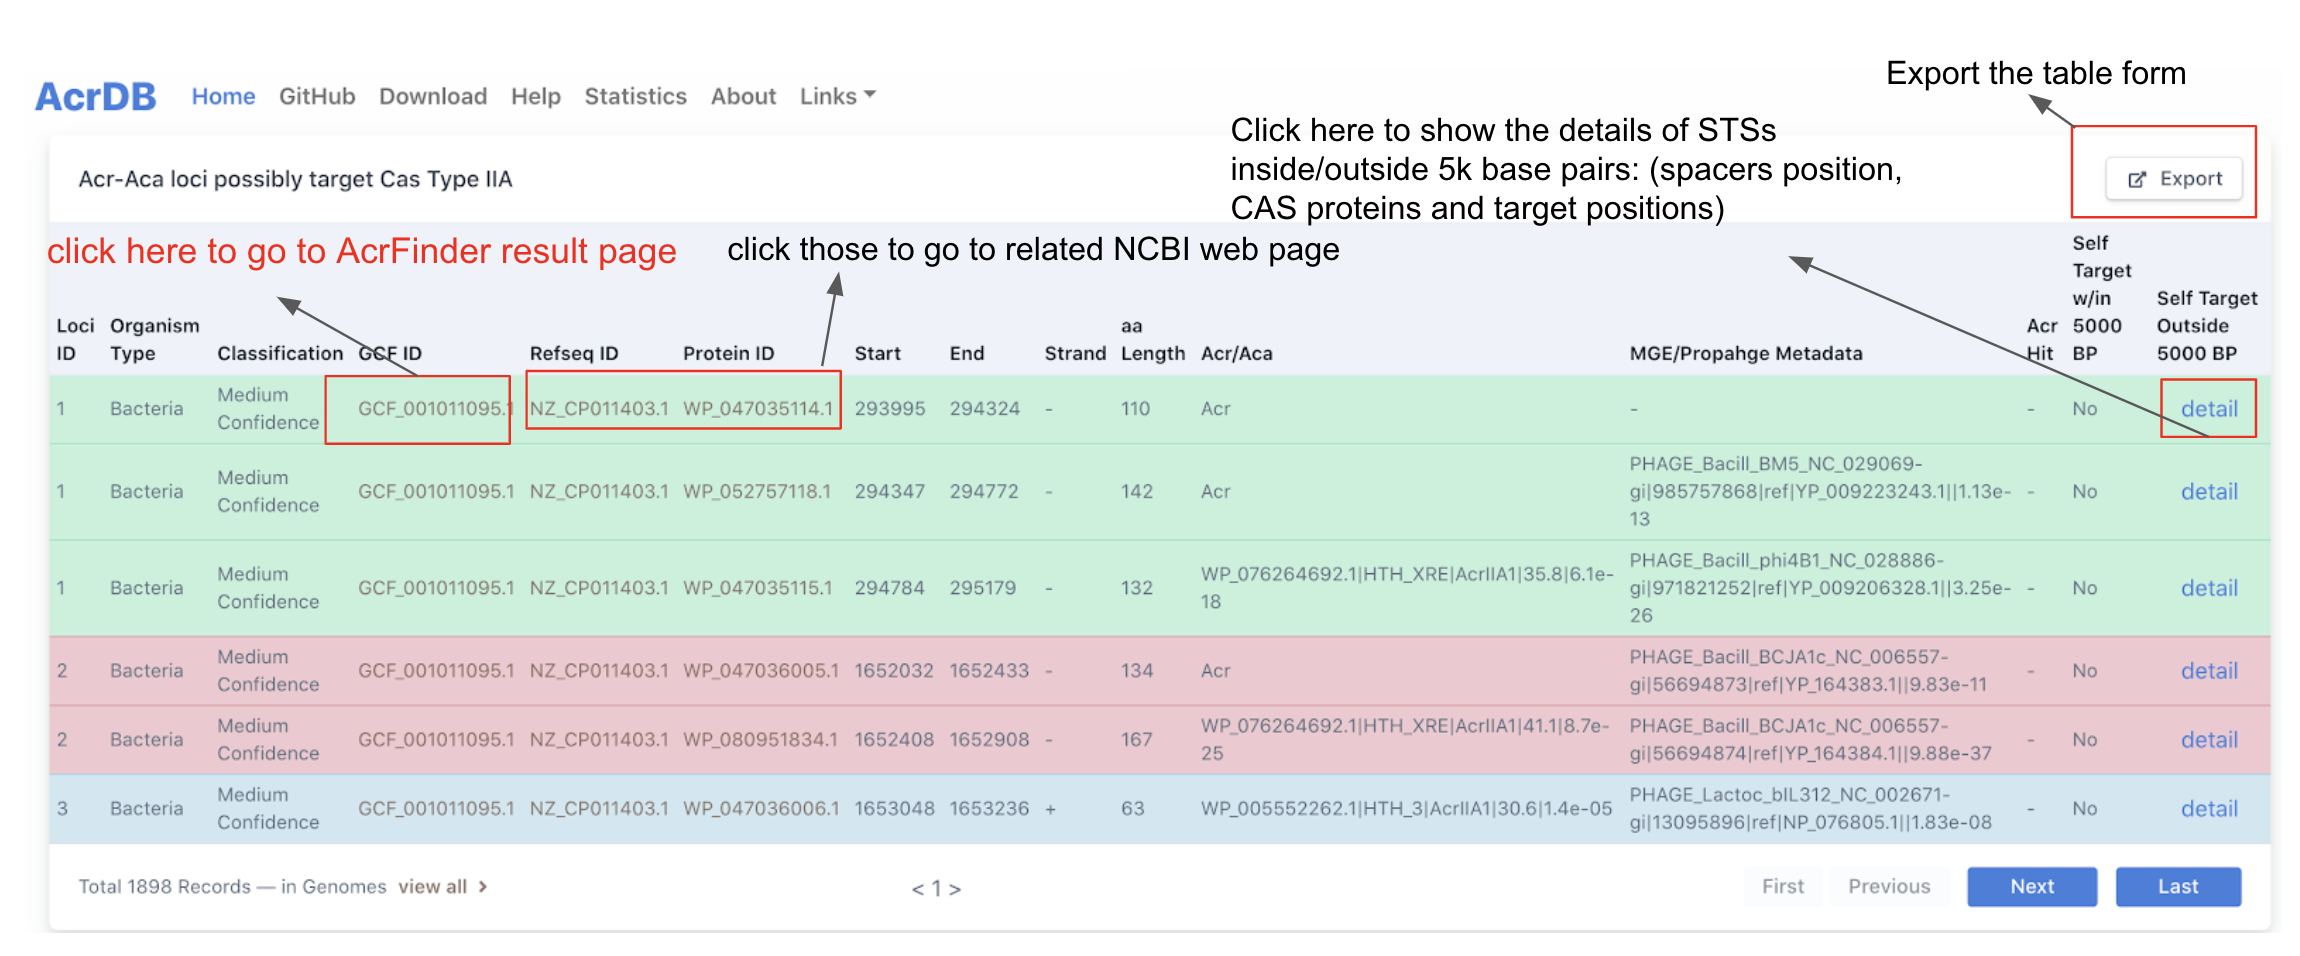
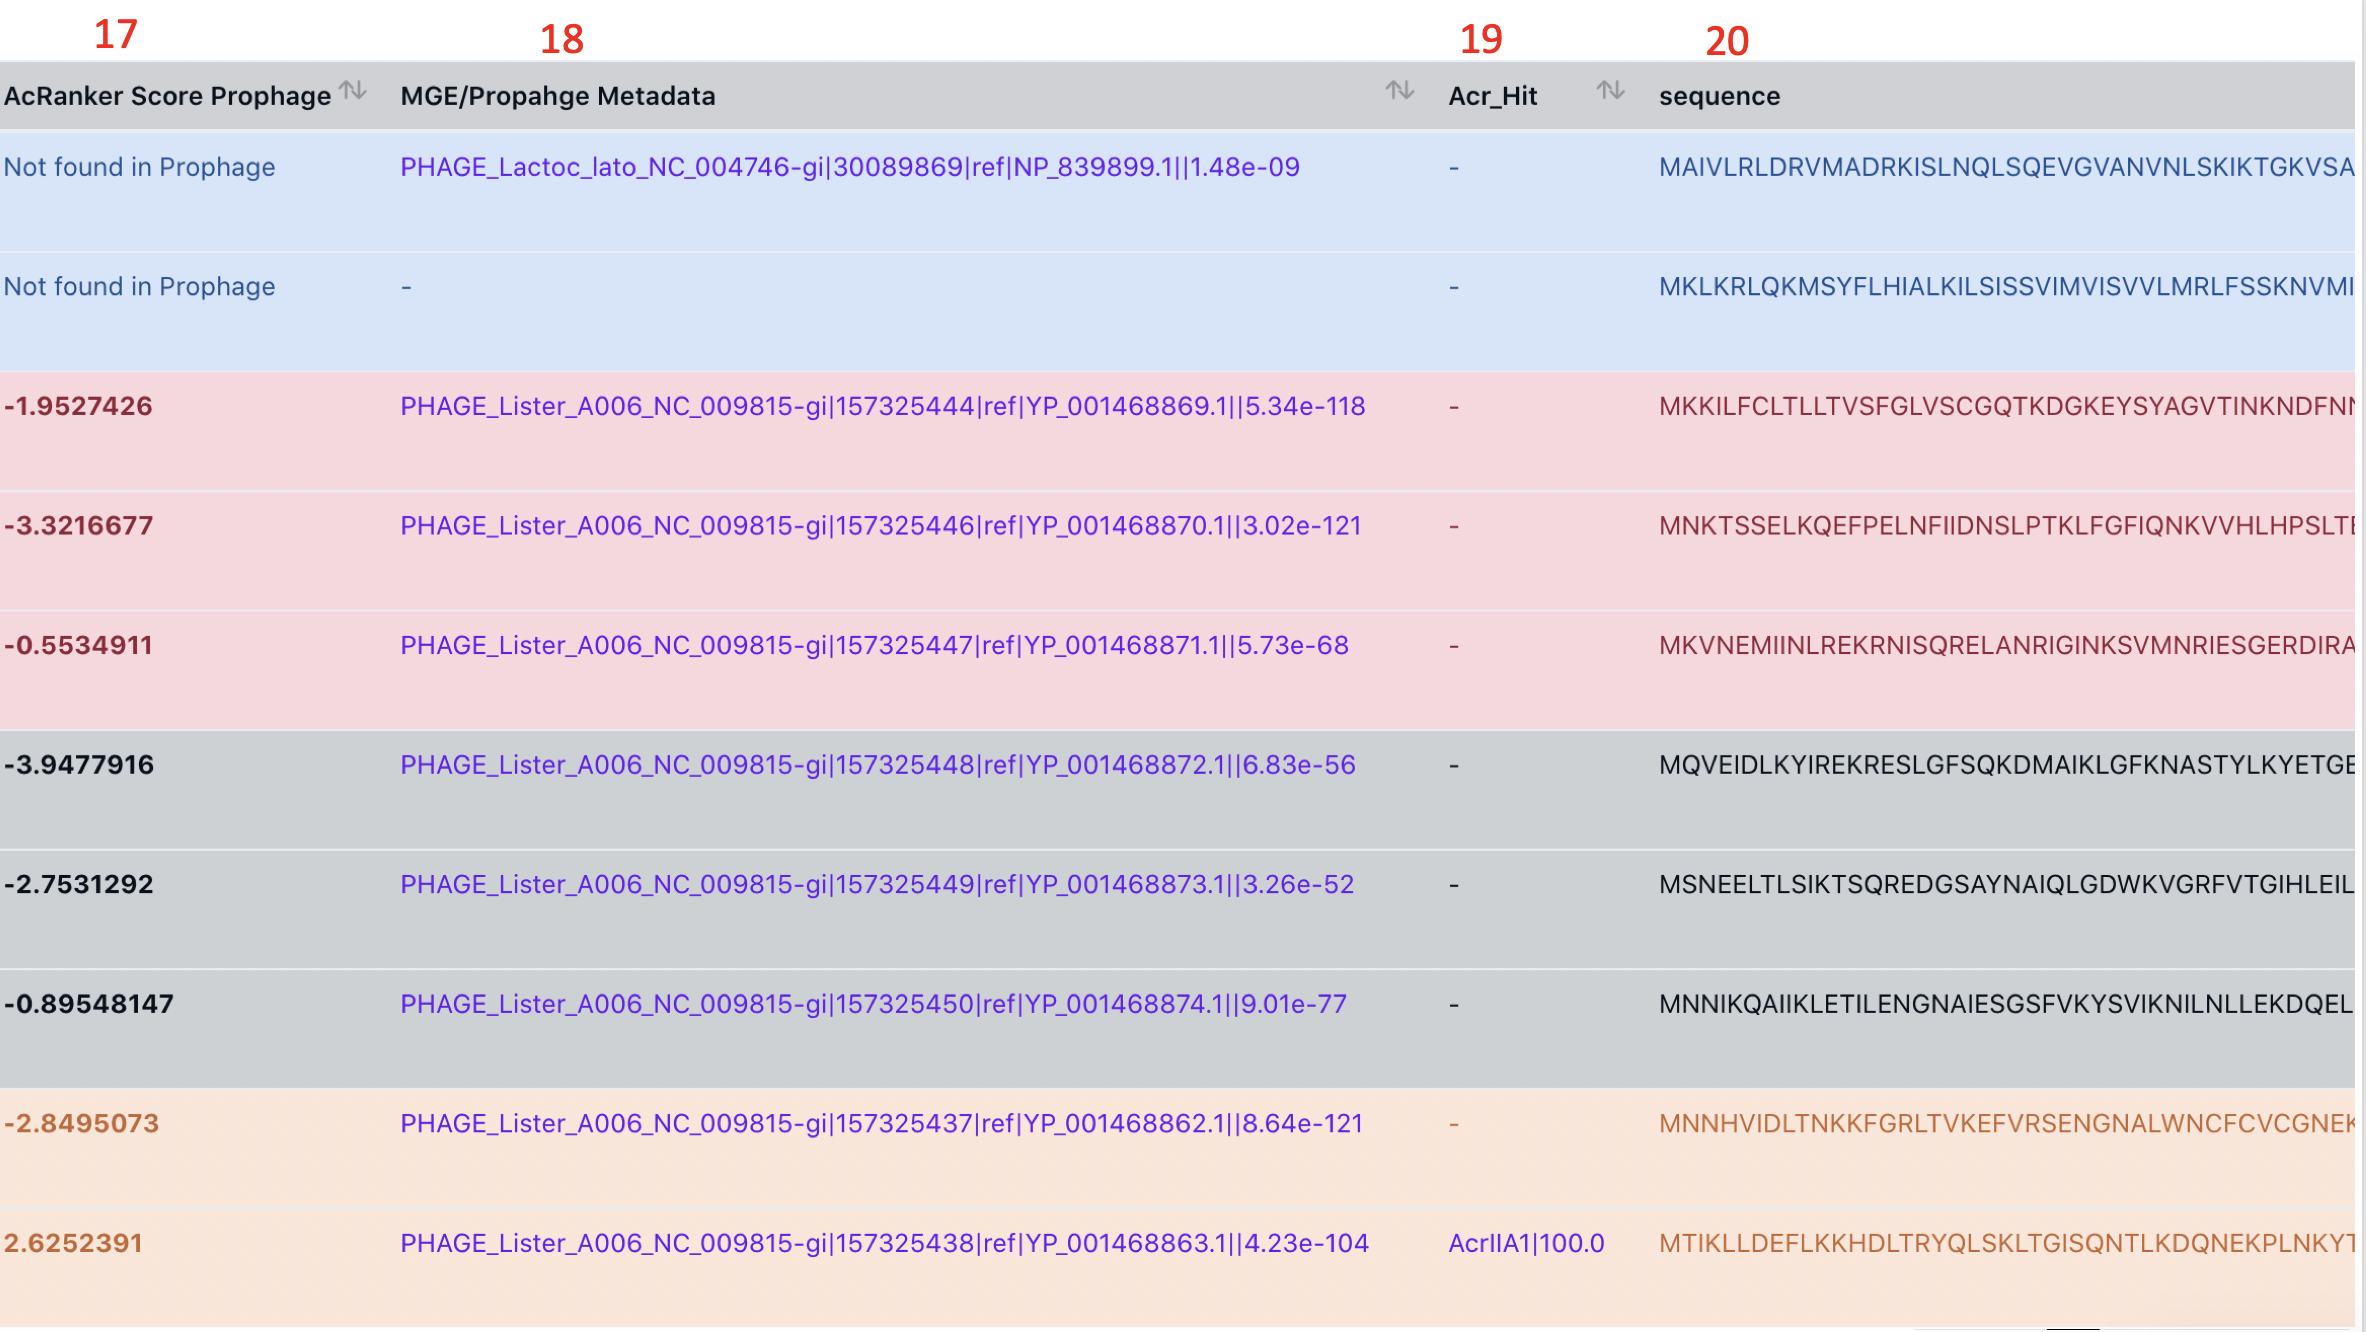
Once the search button is clicked, the result page will be shown as the figure below, which has the following columns:
Loci ID, organism type, classification, GCF ID, Refseq ID, Protein ID, Start (start position on the contig/chromosome), End (end postition), strand, aa length, MGE/Prophage Metadata (best blast hit in PHASTER prophage DB), Acr Hit (blast hit to known Acrs), STS target within 5,000 base pairs, STS target outside 5,000 base pairs.
More importantly, you can go to Acr-Aca loci result page by clicking the GCF ID.
(iii) browse by Cas families.
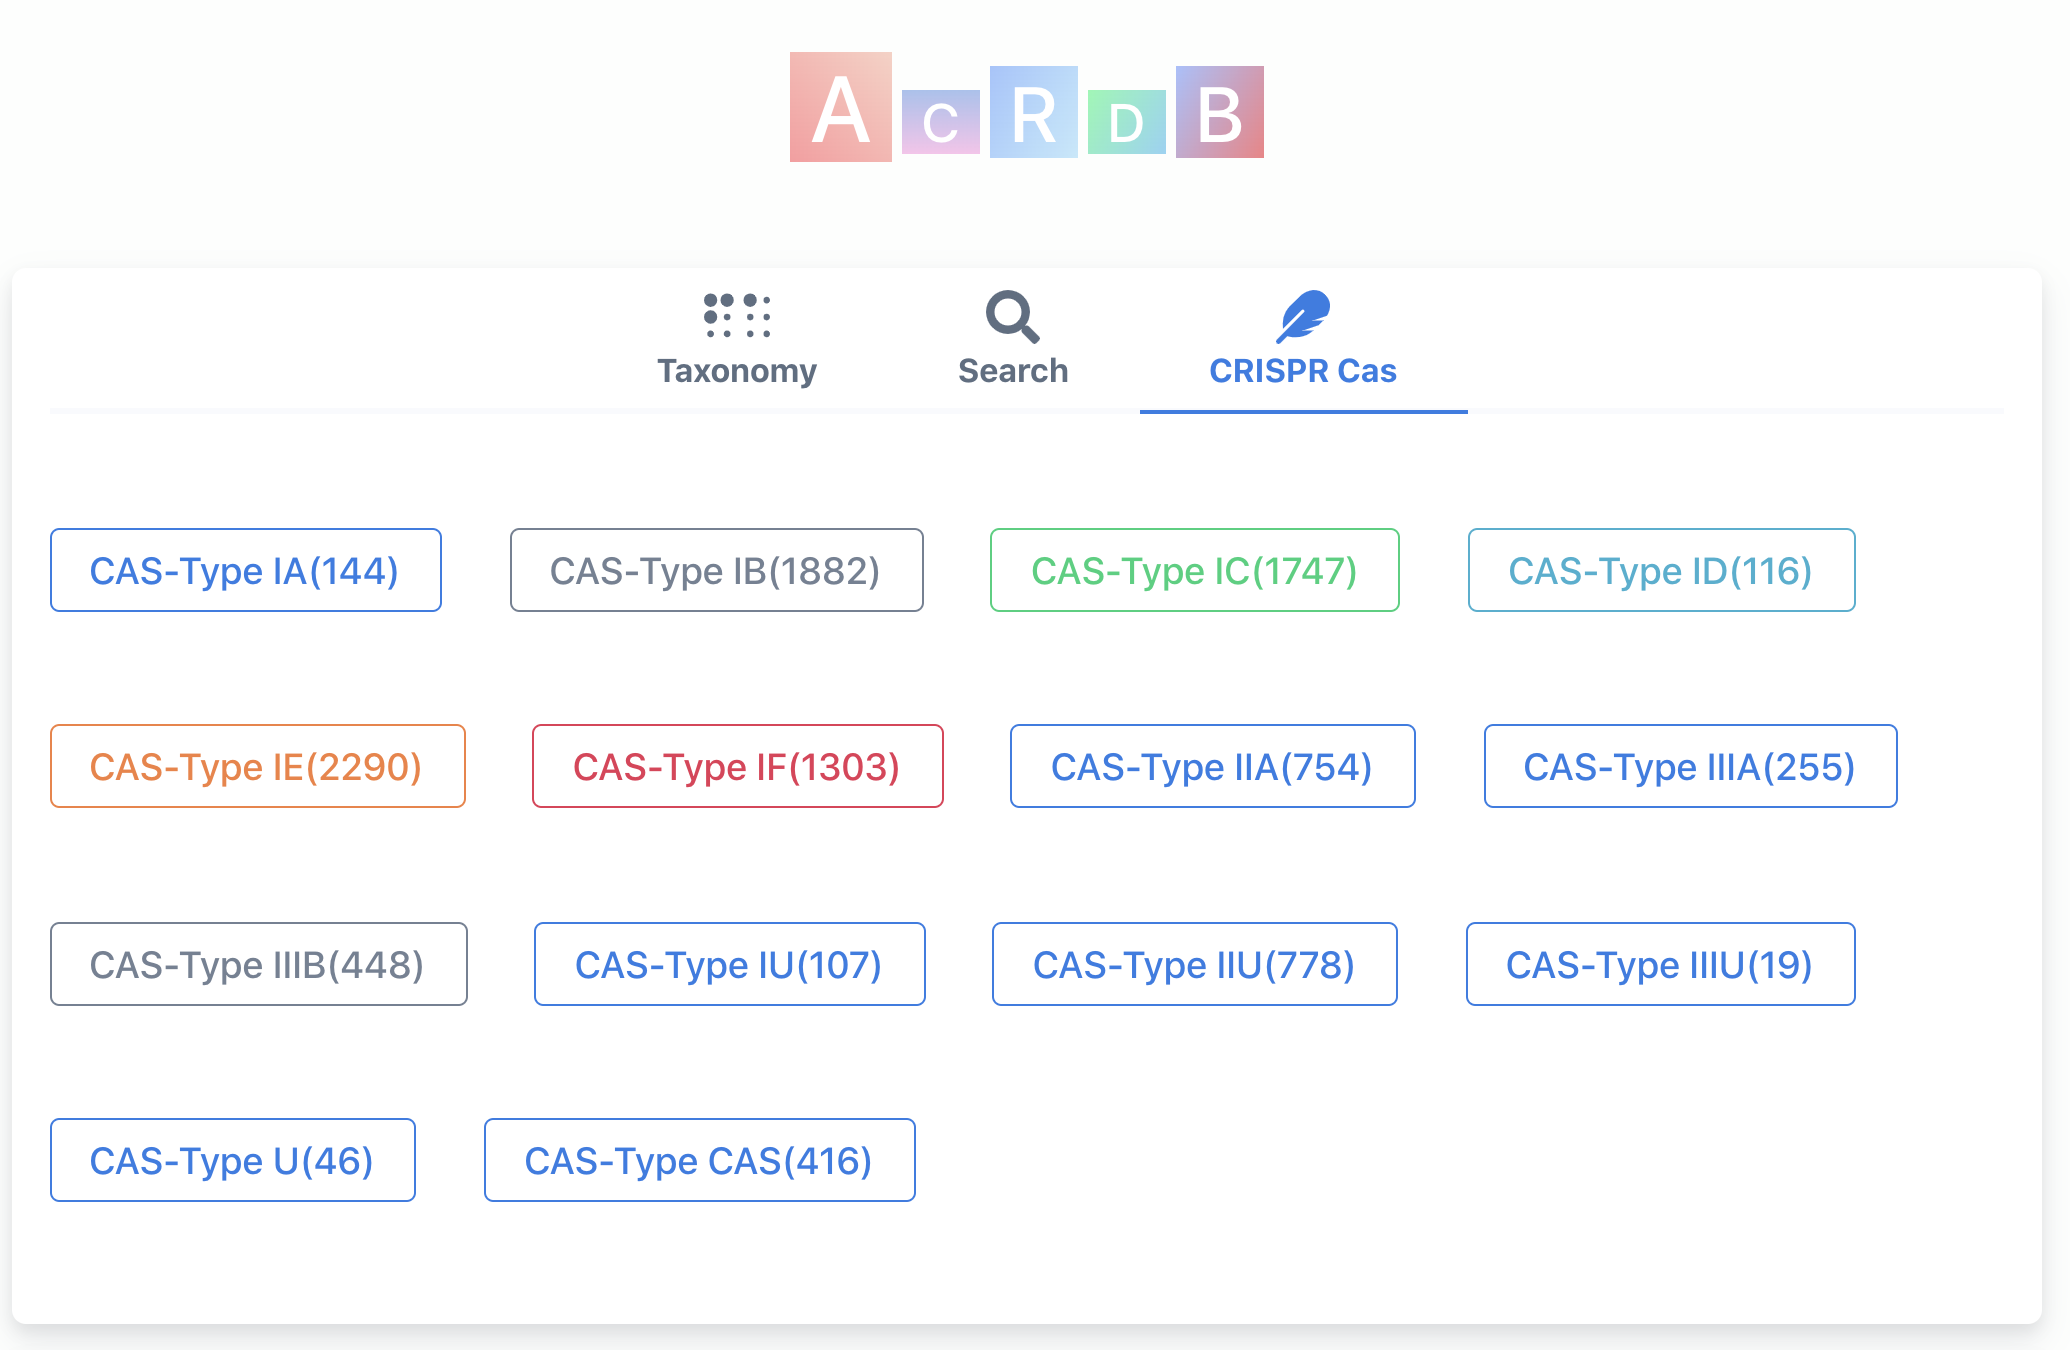
The numbers in the parentheses are the numbers of Acr-Aca loci/operons that are found in genomes with Self Targeting Spacers (STSs) (equivalent to guilt-by-association (GBA) medium+high level by AcrFinder).
Click on one of the Cas subtype will open the following page, which is explained above:
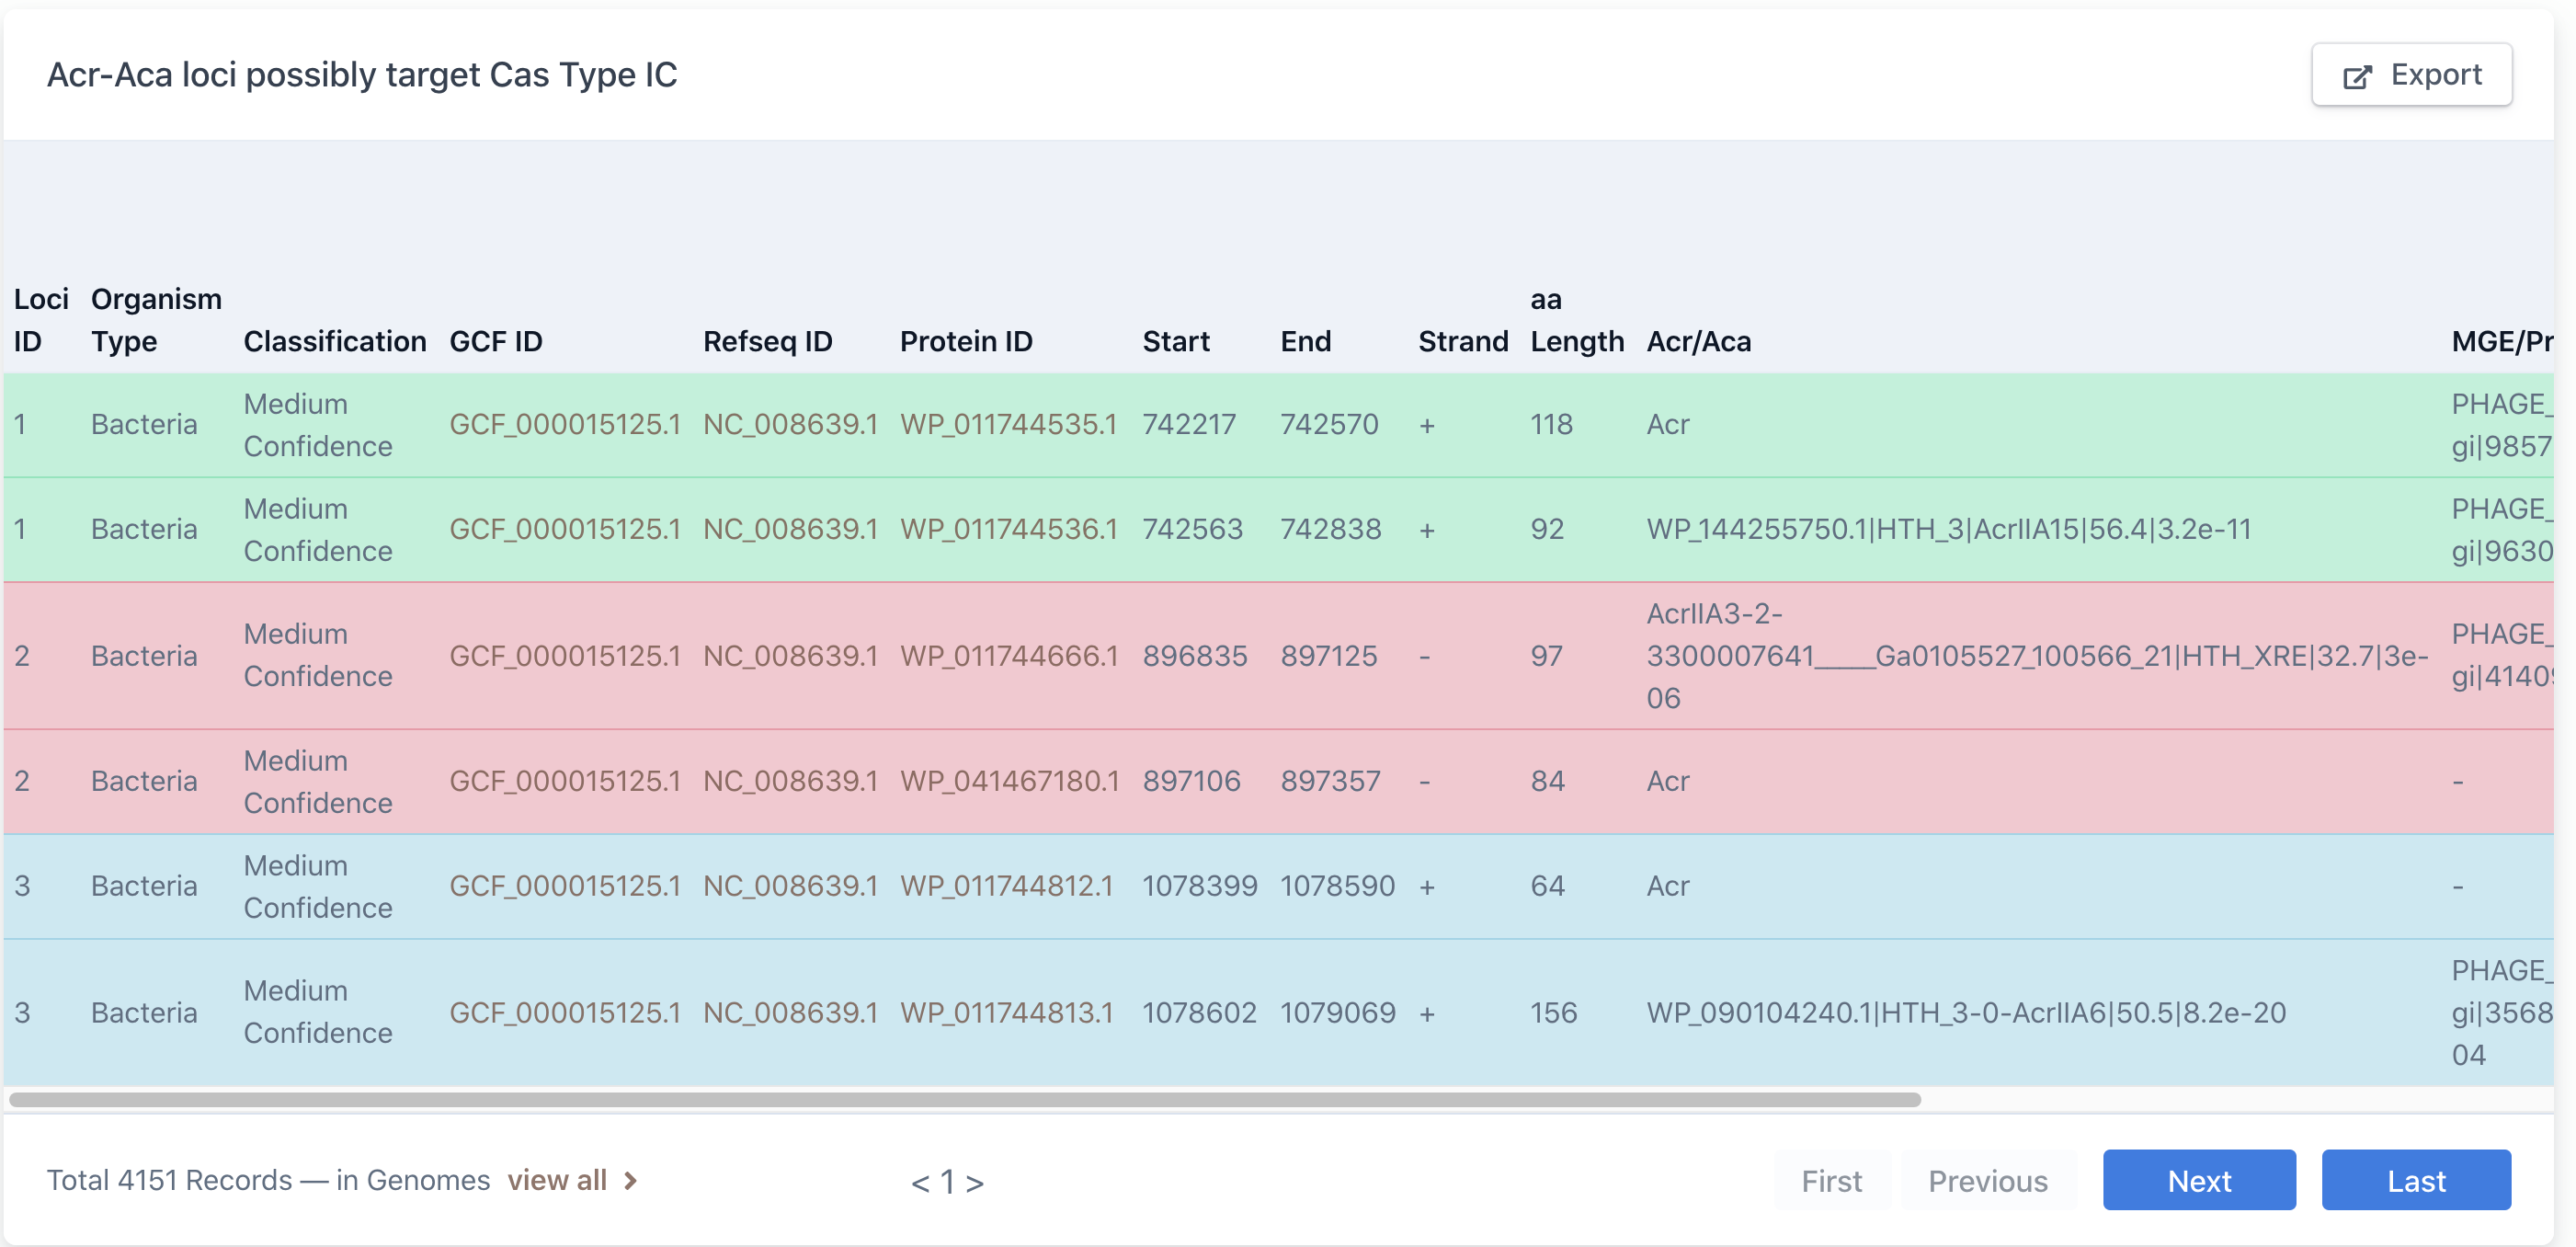
Anti-CRISPR result page
Each genome page shows three different results: (1) AcrFinder guilt by association (GBA) result, (2) AcrFinder Acr homology search result, and (3) CRISPRCasFinder result. GBA result is the most important, and presented in three views: (1.1) Tabular view, (1.2) Graphic view and (1.3) Jbrowse view. Homology and CRISPRCasFinder results are shown in Tabular view only. We will use GCF_001483405.1 (Listeria monocytogenes) as an example.
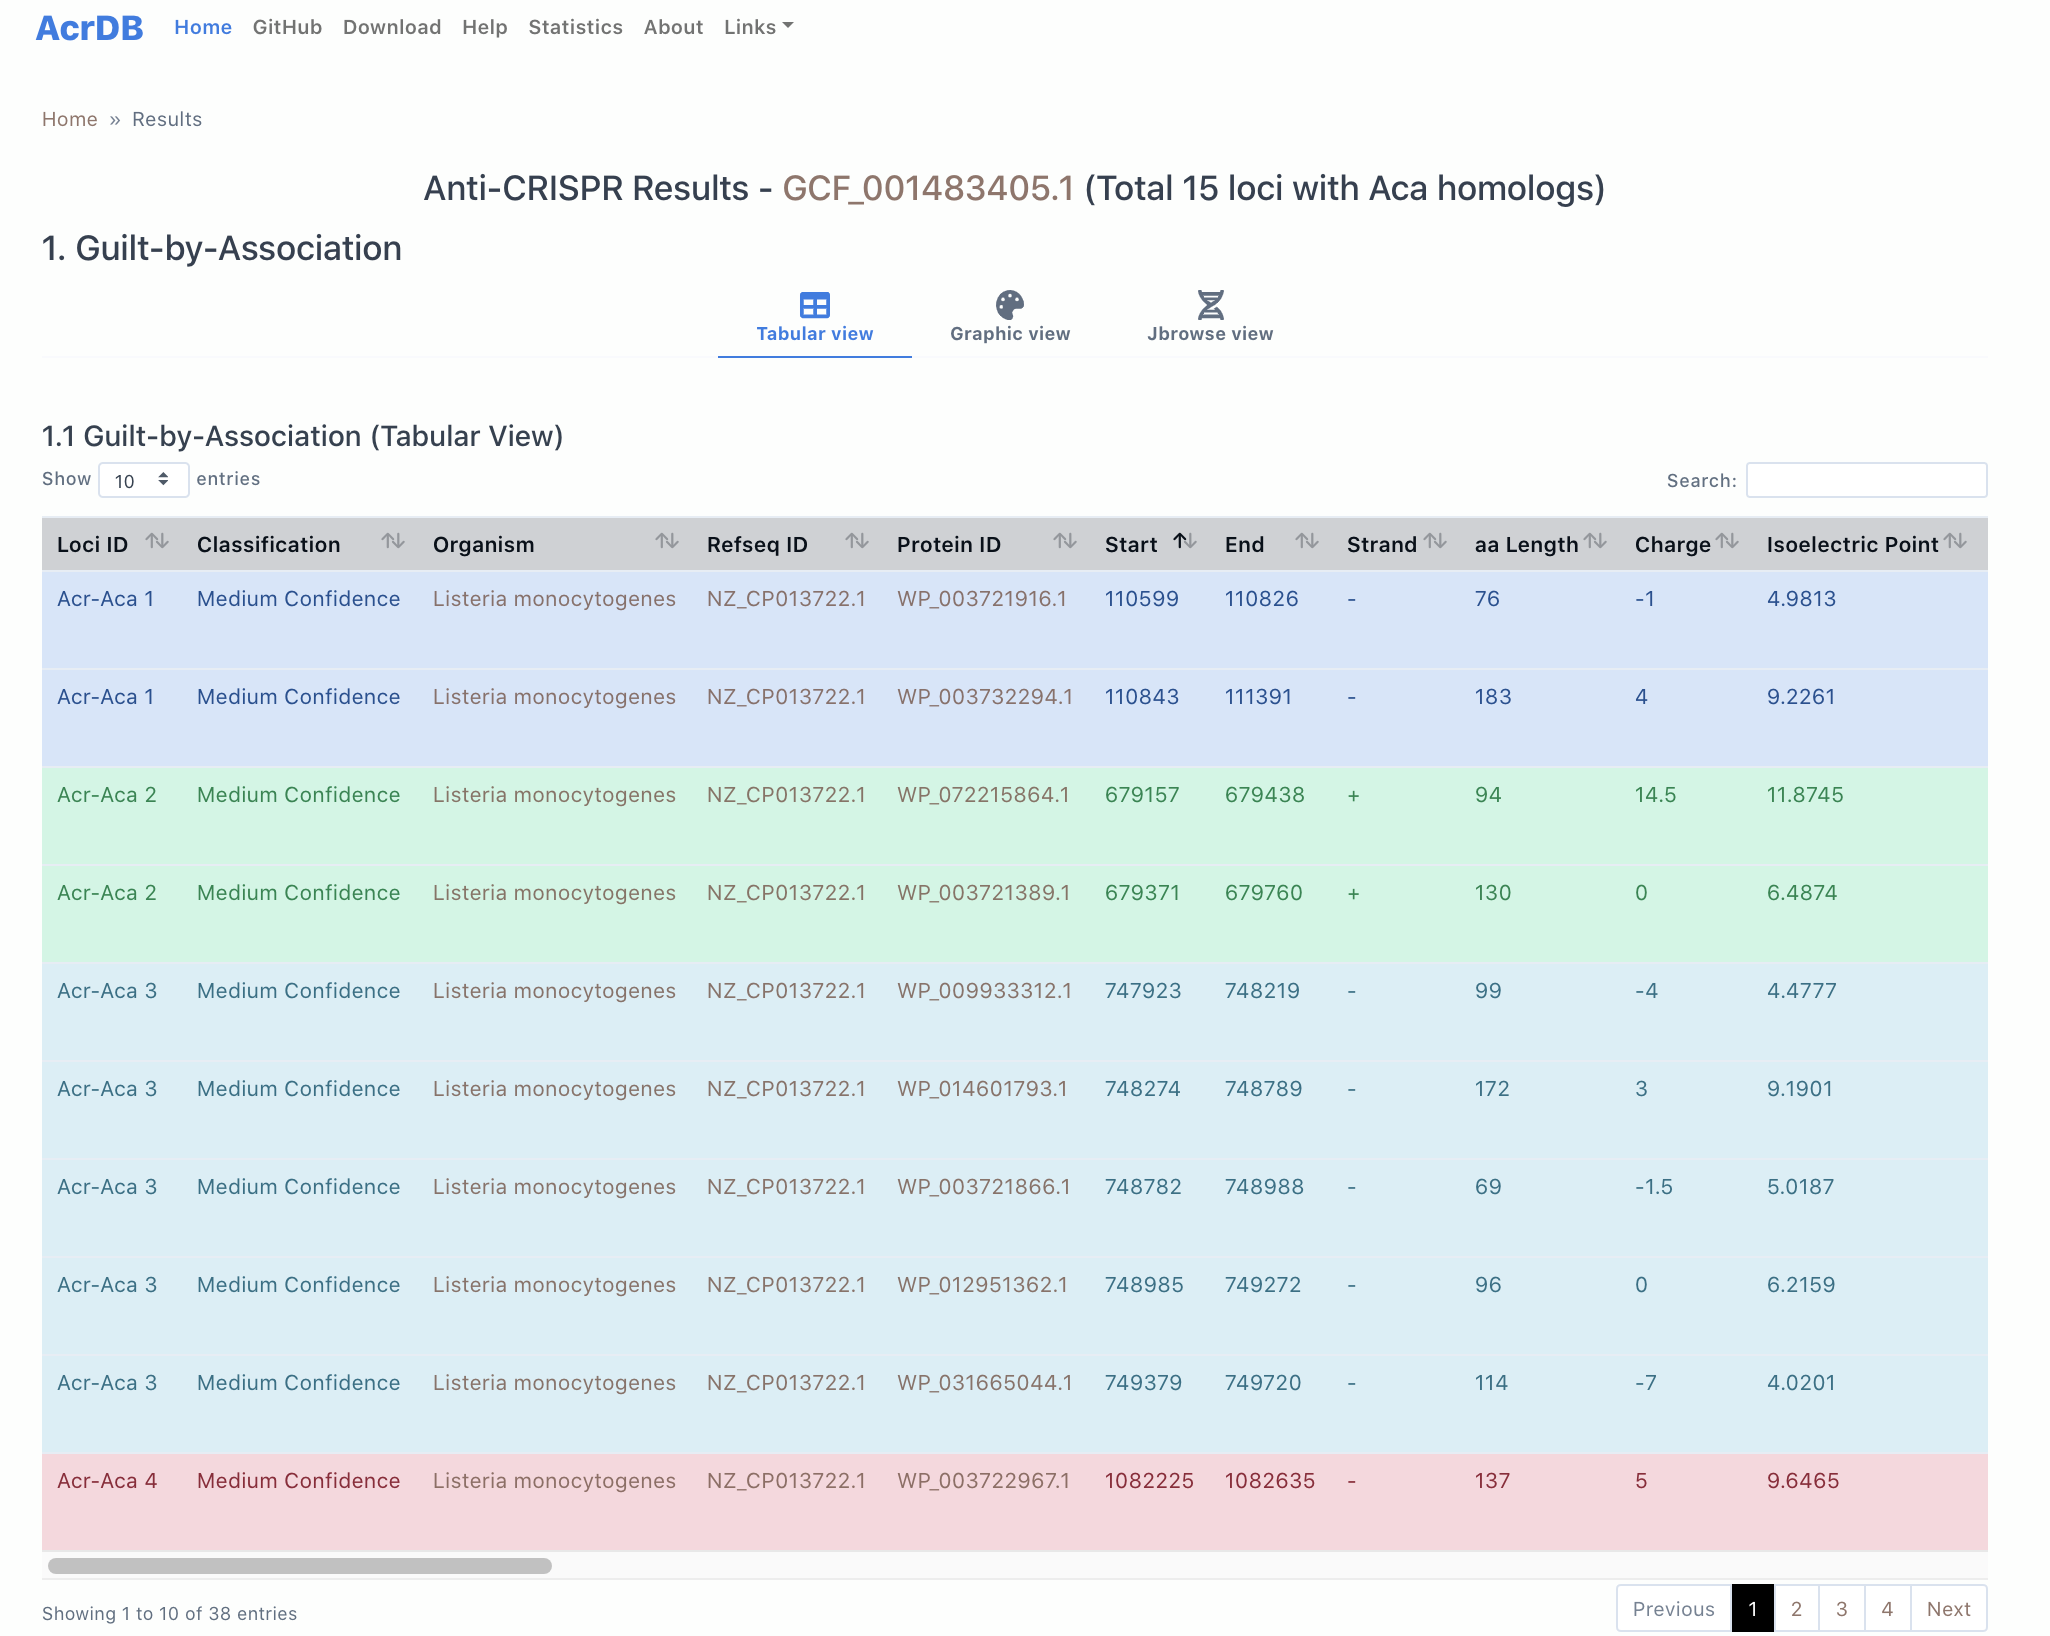
1. Guilt by Association result from AcrFinder
1.1 Tabular view
-
column 1-2: Acr-Aca operon/locus id (1) shows the locus number in this genome. Classification/Confidence levels (2) are explained in AcrFinder workflow.
-
column 3-11: Organism (3) is the species name for this genome, NC ID (4), Protein ID (5), Start (6), End (7), Strand (8), aa Length (9) are parsed/calculated from the faa and gff files of the genome. Protein charge (10) and isoelectric point (11) are calculated by PEPSTATS.
It is not shown, but all the intergenic distances between two neighboring genes within an operon/locus are less than 150bp.
-
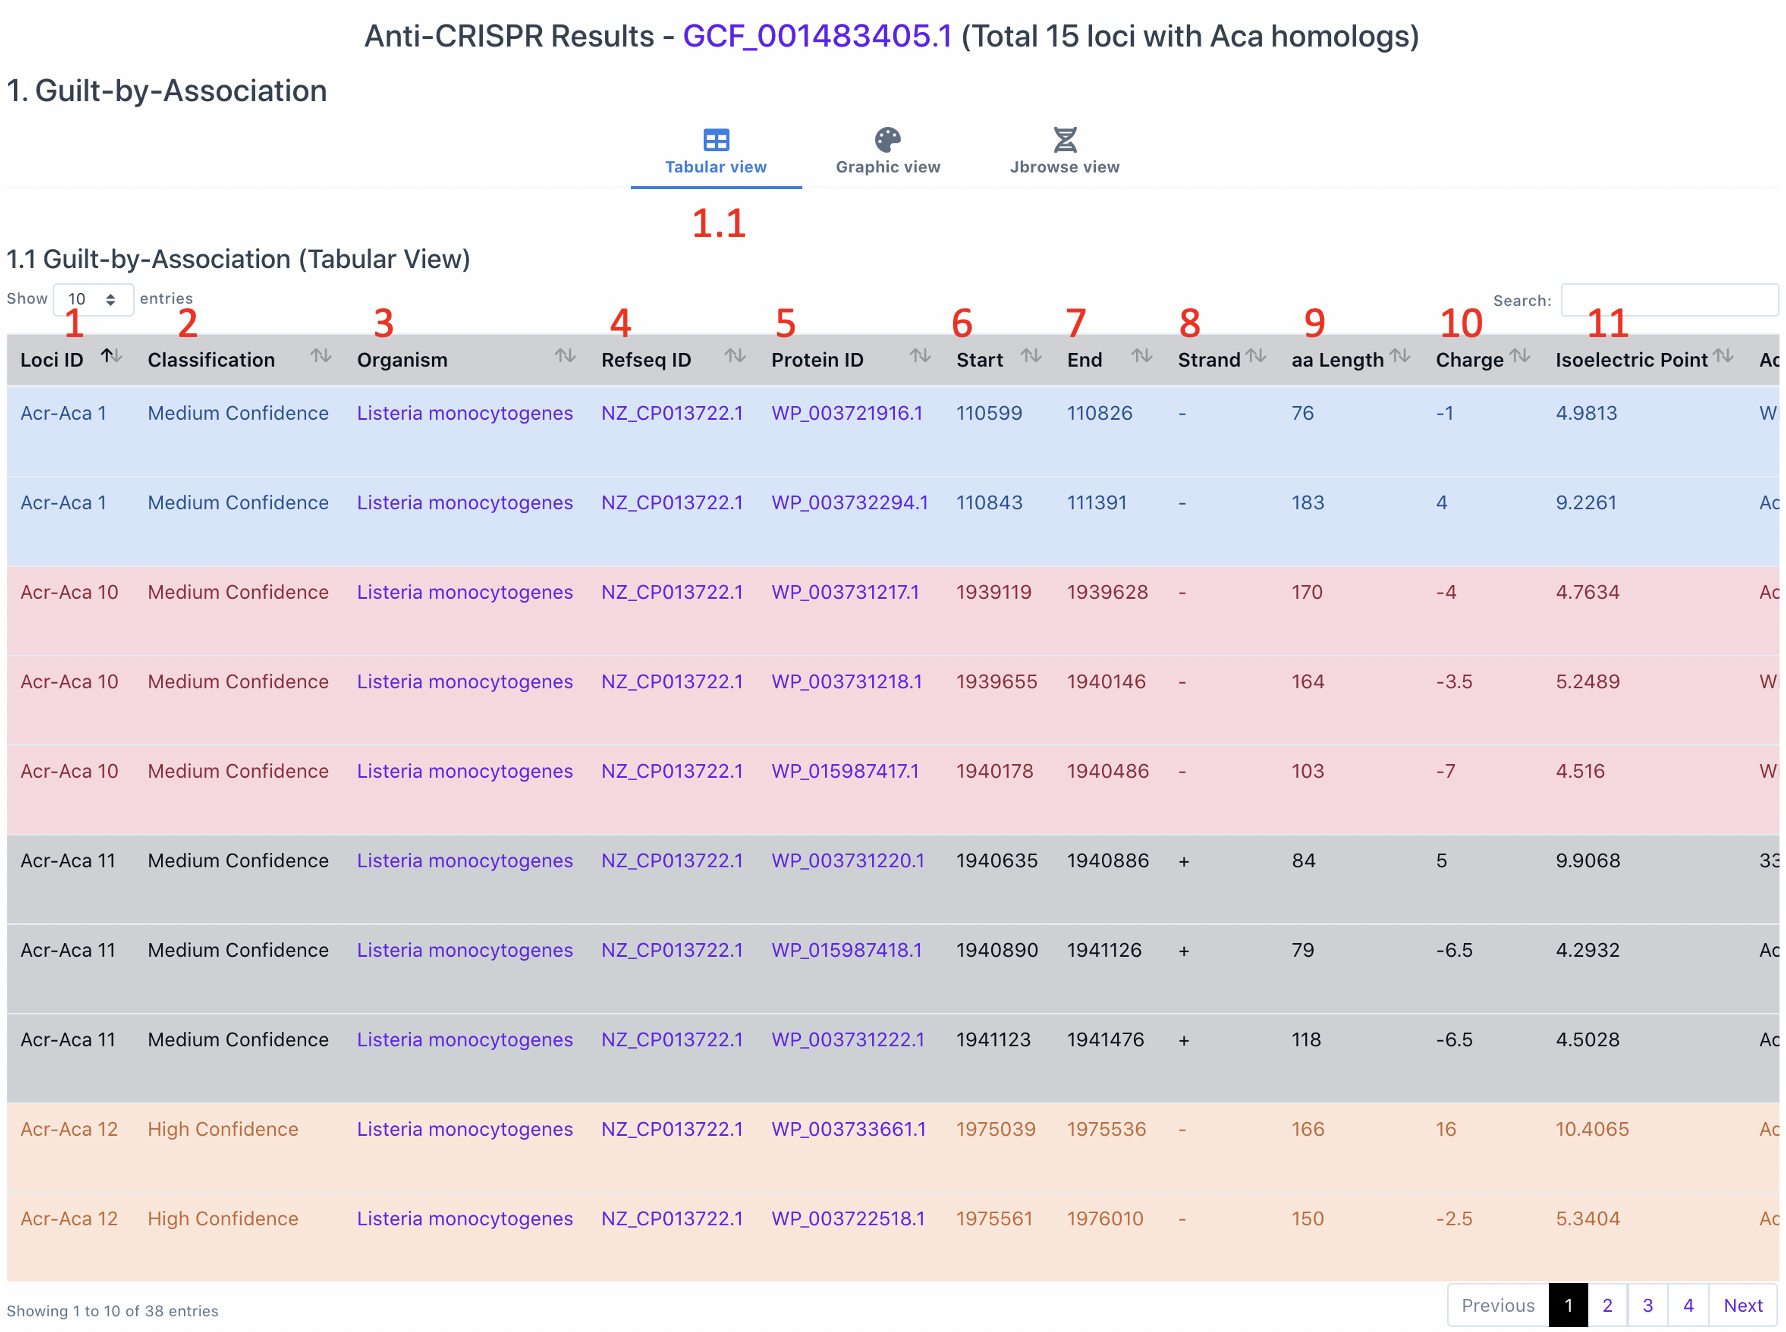
column 12: Acr/Aca column shows the Aca homolog and Acr candidates and need some explanation, e.g.,:
- The protein (WP_003722626.1) in column 5 is homologous to AcrIIA14-0-WP_057707492.1|HTH_5|40.4|1.1e-15 with identity=40.4 and E-value=1.1e-15
- AcrIIA14-0-WP_057707492.1 is a protein (WP_057707492.1) in the Aca database (http://bcb.unl.edu/AcrFinder/Download/database/, compiled according to a method described in our paper). It is an HTH_5-containing protein located 0 gene from a known Acr gene (in this case, it is AcrIIA14) homolog (http://bcb.unl.edu/AcrFinder/Download/database/). In other words, this protein (WP_057707492.1) is regarded as an Aca because it has an HTH domain AND it is next to known Acr genes or their homologs.
- If this column is Acr, that means the protein is an Acr candidate. Acr candidates (they are candidates because they are next to HTH-domain containing proteins) are proteins that may not be homologs of known Acr proteins (if they are, the Acr_Hit column won’t be empty), but sitting next to a protein homologous to Acas.
column 13-17: PaCRISPR and AcRanker Results
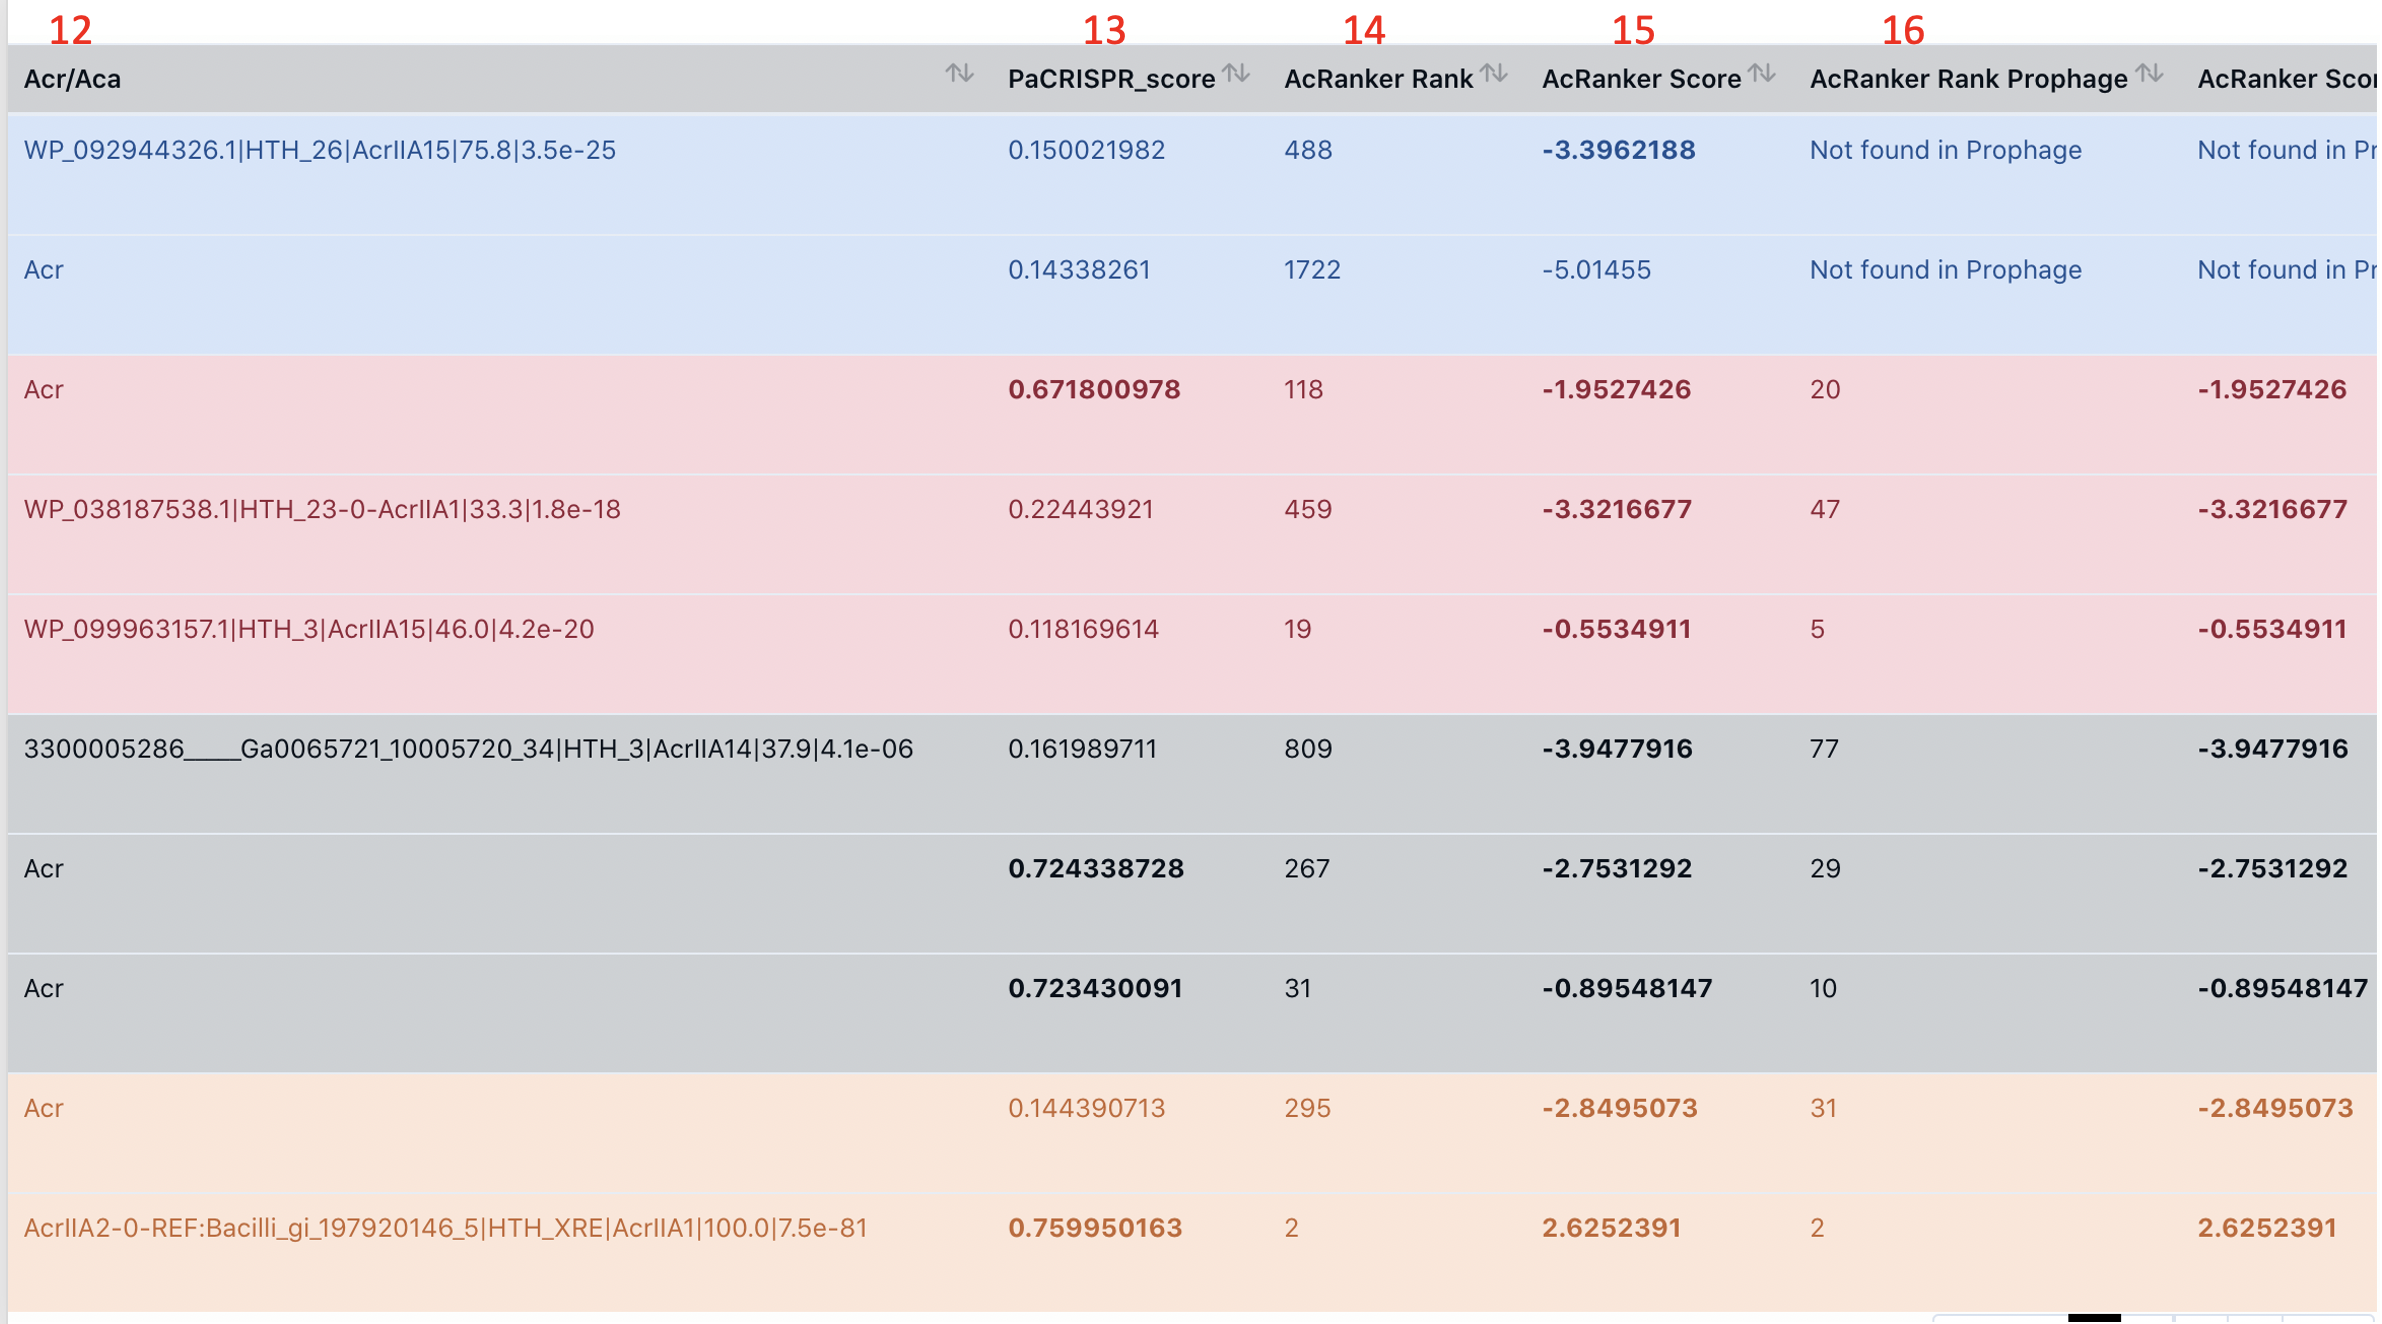
We predict PaCRISPR_score for our prediceted Acr/Acas. PaCRISPR_score > 0.5 is shown in bold face. We also predict the AcRanker rank (14) and Acranker score (15) by running AcRanker on all protein of the genome. In addition, we also predict the AcRanker rank (16) and the score (17) by running AcRanker on only proteins encoded in putative prophage regions (predicted by an in-house program primarily based on blast search against PHASTER DB) of this genome. If the protein is not located in a prophage region, column 16-17 will show "Not found in Prophage".
AcRanker score >-5 (15, 17) are shown in bold face.
-
column 18: MGE/Prophage MetaData shows if a protein is a prophage or mobilome gene (by searching against the prophage PHASTER database) . The last number in the string is the E-value. Clicking on the link can lead to the NCBI description page of the prophage protein. The other parts of the string are from the PHASTER database.
Why does this even matter? That is because most experimentally characterized Acr-Aca loci are located within or nearby a prophage or genomic island or transferred element or other types of mobile genetic elements, in addition to those found in lytic phages/viruses directly.
Read workflow to learn more about it. -
column 19: Acr_Hit shows the best Acr homolog and the alignment identity.
column 20: Sequence Column shows the protein sequence.
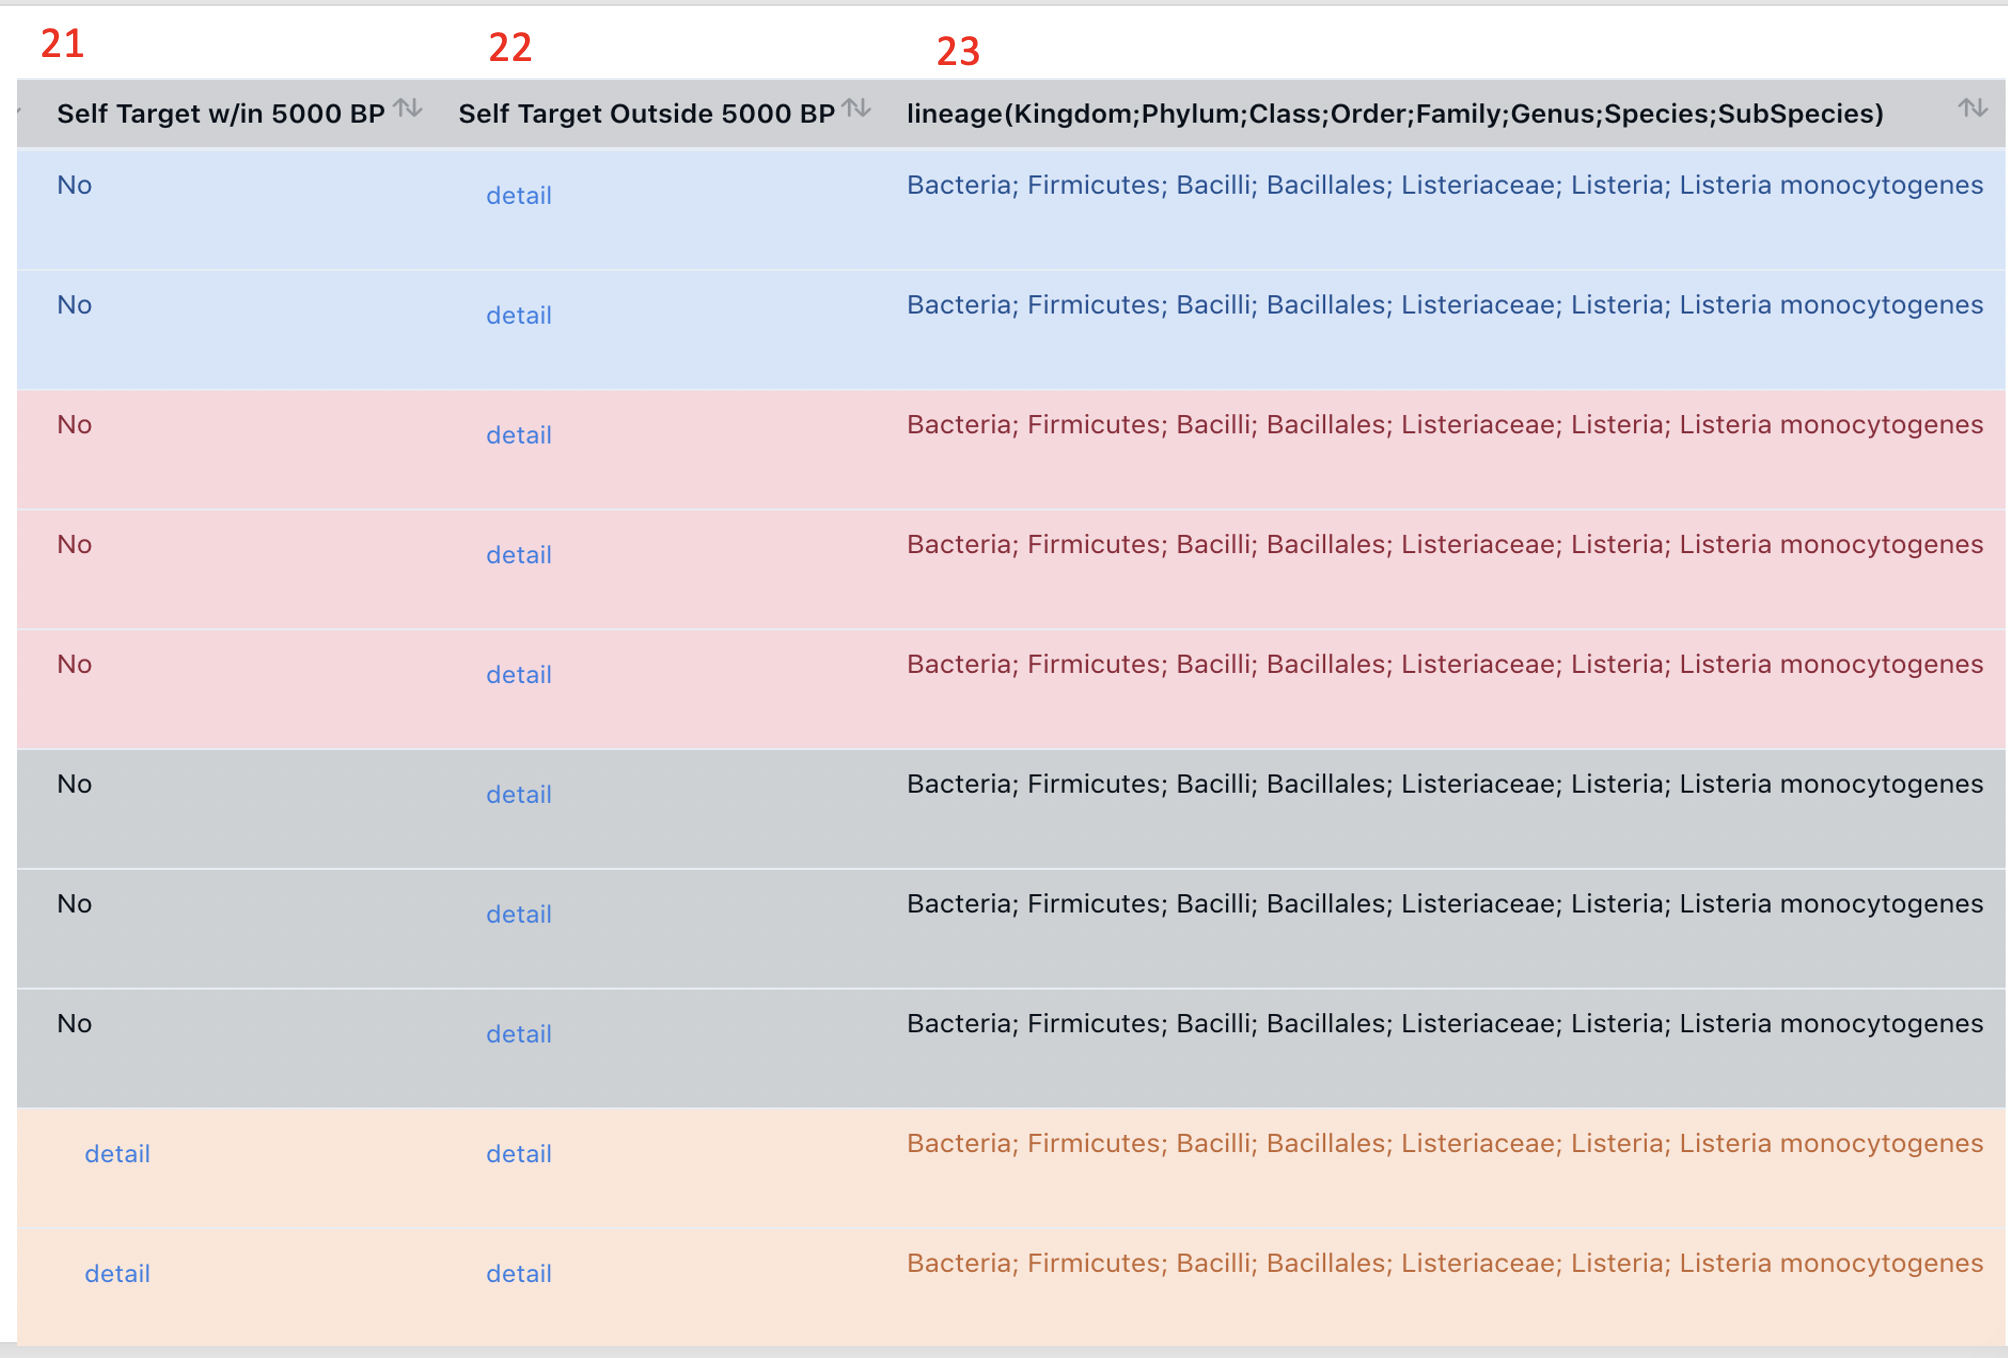
column 21-22:The STS Target w/in (21) or outsidee (22) 5000bp columns show that, within or outside a 5000 bp region of the Acr-Aca locus, if there is a CRISPR-Cas spacer target in the self genome (see Figure 2c of PMID:30208287 [Stanley SY and Maxwell KL, 2018]. If it is, then the chance that the locus encode an Acr is higher. If not empty, the column has a 'detail' link, which can be clicked on and open a new page (see 22.1 and 22.2 below). If it is empty, it will show "no".
Take the Acr-Aca locus 12 as an example, within its 5000bp there is one STS target (22.1), and outside there are two STS targets (22.2):-
22.1: Spacer Accession, Spacer Position (Start-End), CAS-Type columns: These columns are parsed from the result of CRISPRCasFinder (level 3 and 4, see their paper for details ["CRISPR arrays having evidence-levels 3 and 4 may be considered as highly likely candidates"]).
In this example, the contig NZ_CP013722.1 has a CRISPR spacer (positions are given), which match a target (see below 22.1) with a sequence identity = 100% in the same contig (i.e., self-targeting). NZ_CP013722.1 also has two CAS loci with Type info predicted by CRISPRCasFinder, and their positions are given in the CAS-Type column.
-
22.2: Two STS targets outside of the 5000bp of the Acr-Aca locus 12.
Read workflow to learn more about it.
-
-
Note it is very possible that some genomes do have an Acr-Aca locus output, but have no self-targeting CRISPR spacer or even no level 3 & 4 CRISPR-Cas systems (discussed in our paper) (i.e., both 21 and 22 columns are empty). For these cases, if they have level 3 & 4 CRISPR-Cas systems, they are labeled as "low confidence" loci (A.K.A Classification column will show Low Confidence). If they do not have level 3 & 4 CRISPR-Cas systems, they will not show up in the Guilt by Association section, but may appear in the Homology Based section.
-
column 19: lineage
It shows the lineage (Kingdom;Phylum;Class;Order;Family;Genus;Species;SubSpecies) extracted by taxonomy Enterize DB
1.2 Graphic view
The graphic view for AcrFinder GBA result has three parts:
- (i) Circluar genome view for Aca-Acr loci and STSs.
- (ii) Linear zoomed-in view for Acr-Aca loci.
- (iii) Linear zoomed-in view for CRISPR-Cas loci with STSs
It should be mentioned that all the images in this graphic view page can be downloaded in SVG or PNG format. The download option ( Download SVG PNG ) are on the upper left of this section.
Another note is that all complete bacterial and complete archaeal genomes have all the three parts: (i), (ii) and (iii); Incomplete (or not fully assembled) archaeal genomes will have the (ii) and (iii) parts. Viral genomes will only have the (ii) part.
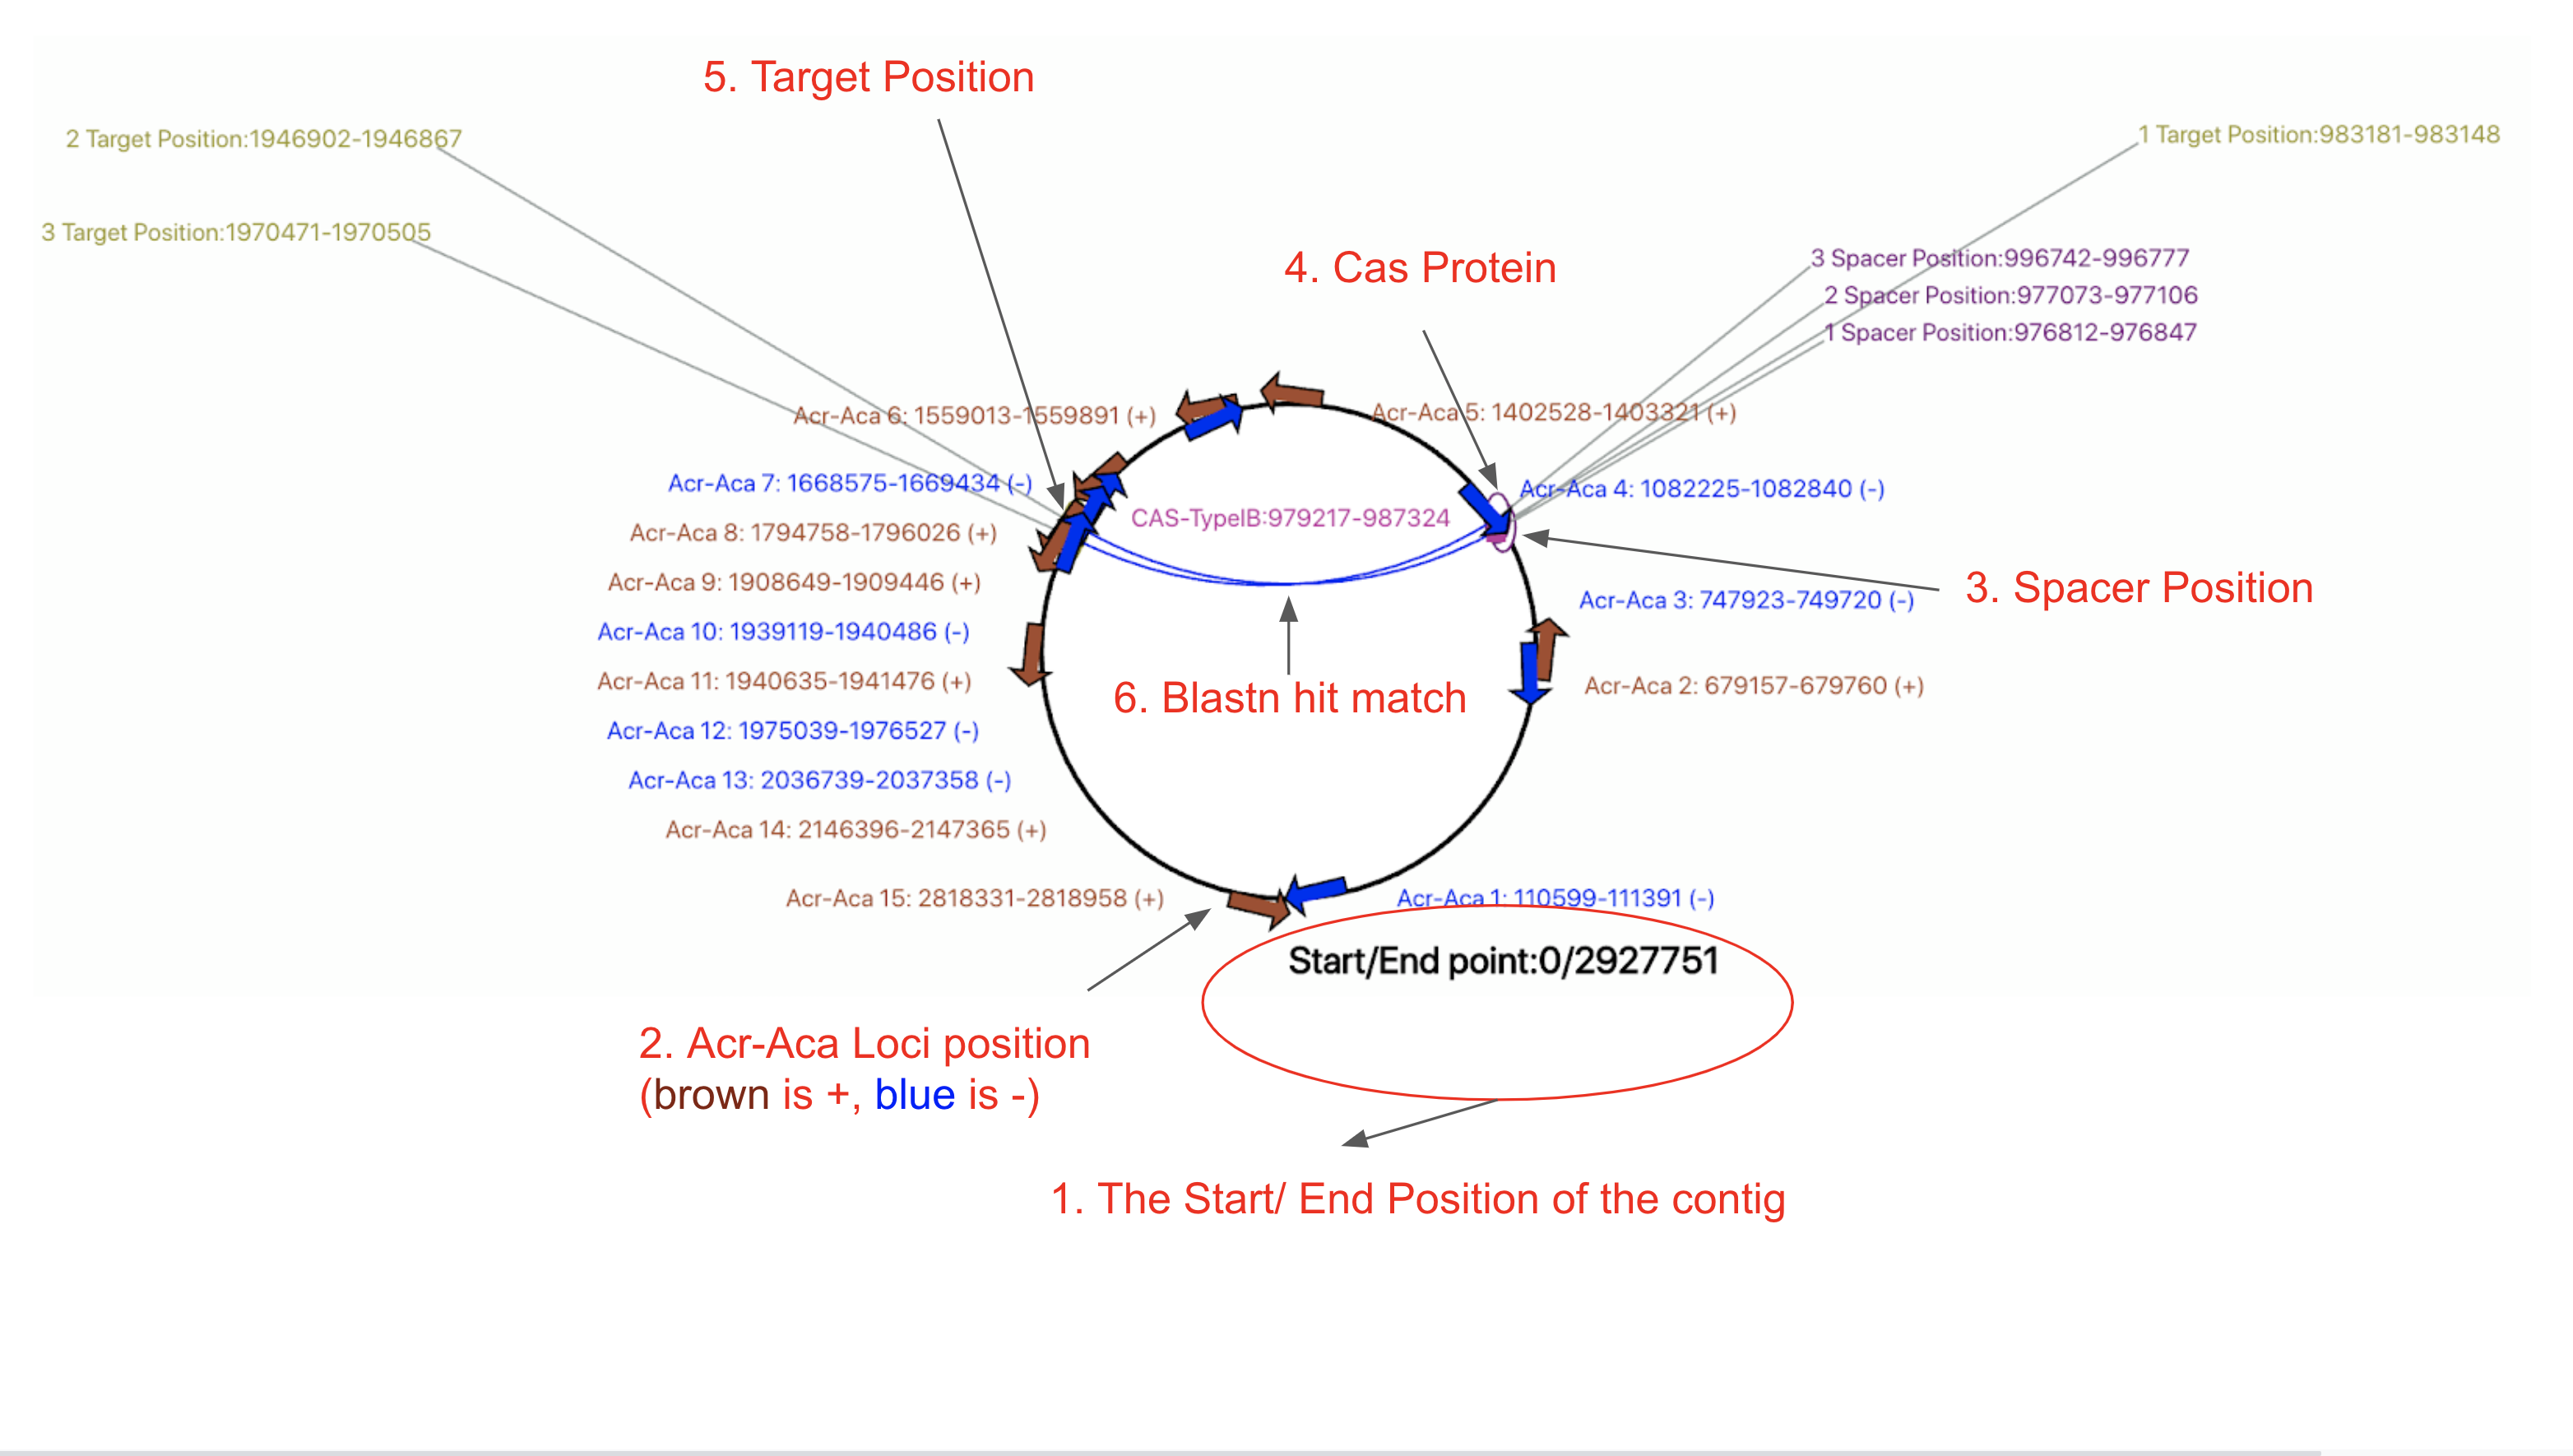
We will use GCF_001483405.1 (Listeria monocytogenes) as an example, which has a single completely assembled genome, to explain the (i), (ii) and (iii) parts of the graphic view.
(i) Circular genome view
-
1. The start/end position of the genome. The start and end point of the chromosome/contig is always in the middle lowest position of the circle. The end position is the total length of the chromosome/contig.
-
2. Acr-Aca operon/loci position. (Arrow Shape, "+" in brown, "-" in blue). Acr-Aca loci are visualized as arrows in brown/blue on the circle.
-
3. Spacer position. ( Ellipses in stroke purple color filled with white color). Only self-targeting spacers (STSs) are shown, i.e., a genome might contain multiple CRISPR-Cas loci, and those do not contain STSs are not shown here. Spacer position in CRISPR array is predicted by CRISPRCasFinder. STSs are shown as ellipses in stroke purple color filled with white color. The size is not proportionaly to the real spacer length. The labels indicating the actual postion of the STS (e.g. 1 Spacer Postion:976812-976847) are connected with a straight line to the ellipses on the circle.
-
4. Cas loci. ( Pink filled square with pink lables ). The Cas loci are predicted by CRISPRCasFinder. A genome might contain multiple CRISPR-Cas loci, and those do not contain STSs are not shown here.
-
5. Target postion. ( Ellipse in stroke in yellow green color filled with white color). The STS targets are identified by a BLASTn search with all the CRISPR spacers as query (see abovee in 1.1 Tabular view for GBA: column 20-21). The labels indicating the actual position of the STS targets (e.g. 2 Target Position:1946902-1946867) are connected with a straight line to the ellipses on the circle.
-
6. STS and target connection arcs. (The blue arc connecting spacers and targets inside the circle). We represent the STS spacer-target pairs by using arc lines in blue to connect them.
(ii) Linear local zoomed-in view for Acr-Aca Loci
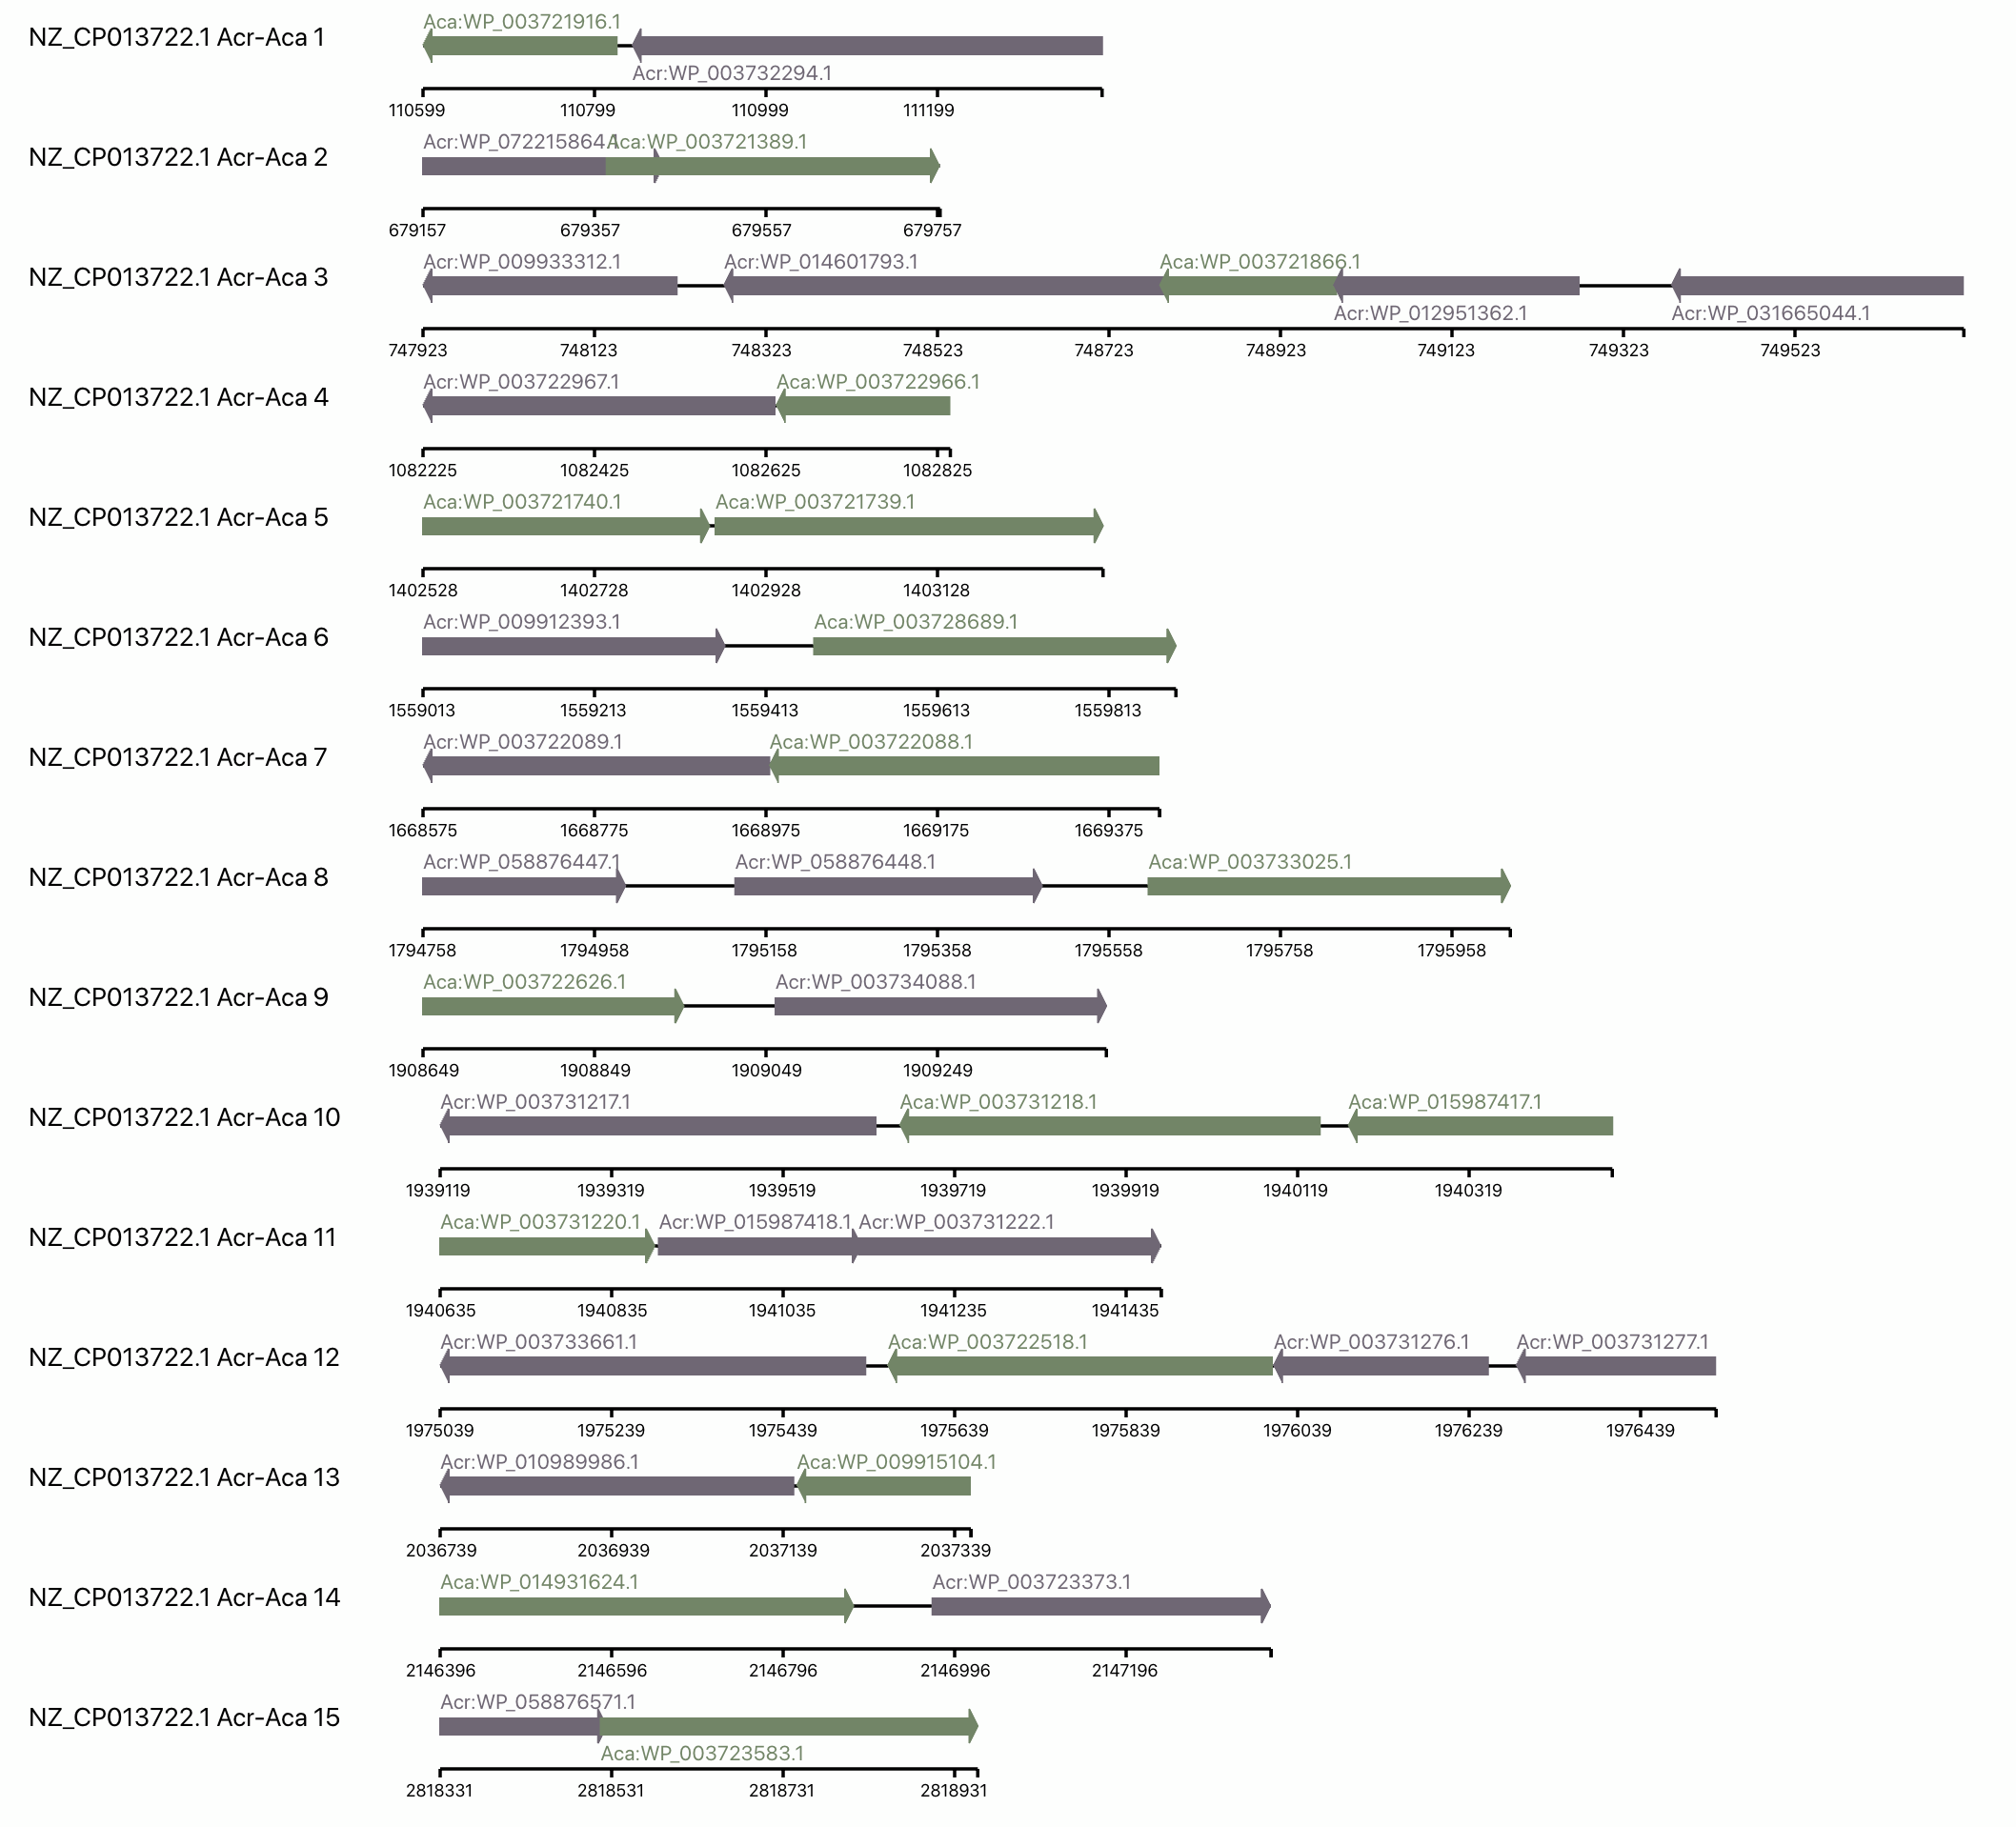
We provide a linear gene view for every Acr-Aca operon/loci identified by AcrFinder GBA.
In each operon, each arrow represents a gene, and the arrow direction represents the strand info of the gene.
Aca is in green while Acr is in grey.
We also add a ruler under each operon to show the position coordinate in the chromosome/contig.
(iii) CRISPR-Cas loci that contains self-targeeting spacers (STSs)
CRISPRCasFinder is used to generate data for this section.
In this example, the scale of the CRISPR array is the same as the Cas loci, one can see the relative length between the Cas Loci and the CRISPR array of a nearest CRISPR-Cas locus that contains STSs. A genome might contain multiple CRISPR-Cas loci, and those do not contain STSs are not shown here and in the above circular genome view.
We locate the CRISPR array that contains STSs first, then look for neighboring Cas loci. If the distance between CRISPR array and the neighboring Cas locus is larger than 10,000 bp, we won't show them.
In the CRISPR array part, the retangles are spacers, and the diamonds are the direct repeat.
In the Cas locus part, the Cas proteins are pink arrows.
There are dots between the CRISPR array and the Cas loci, which means these regions are omitted in drawing to keep the figure not too wide.

If the crispr array locates inside the CAS Loci, the CRISPR-Cas Array will be shown like this:

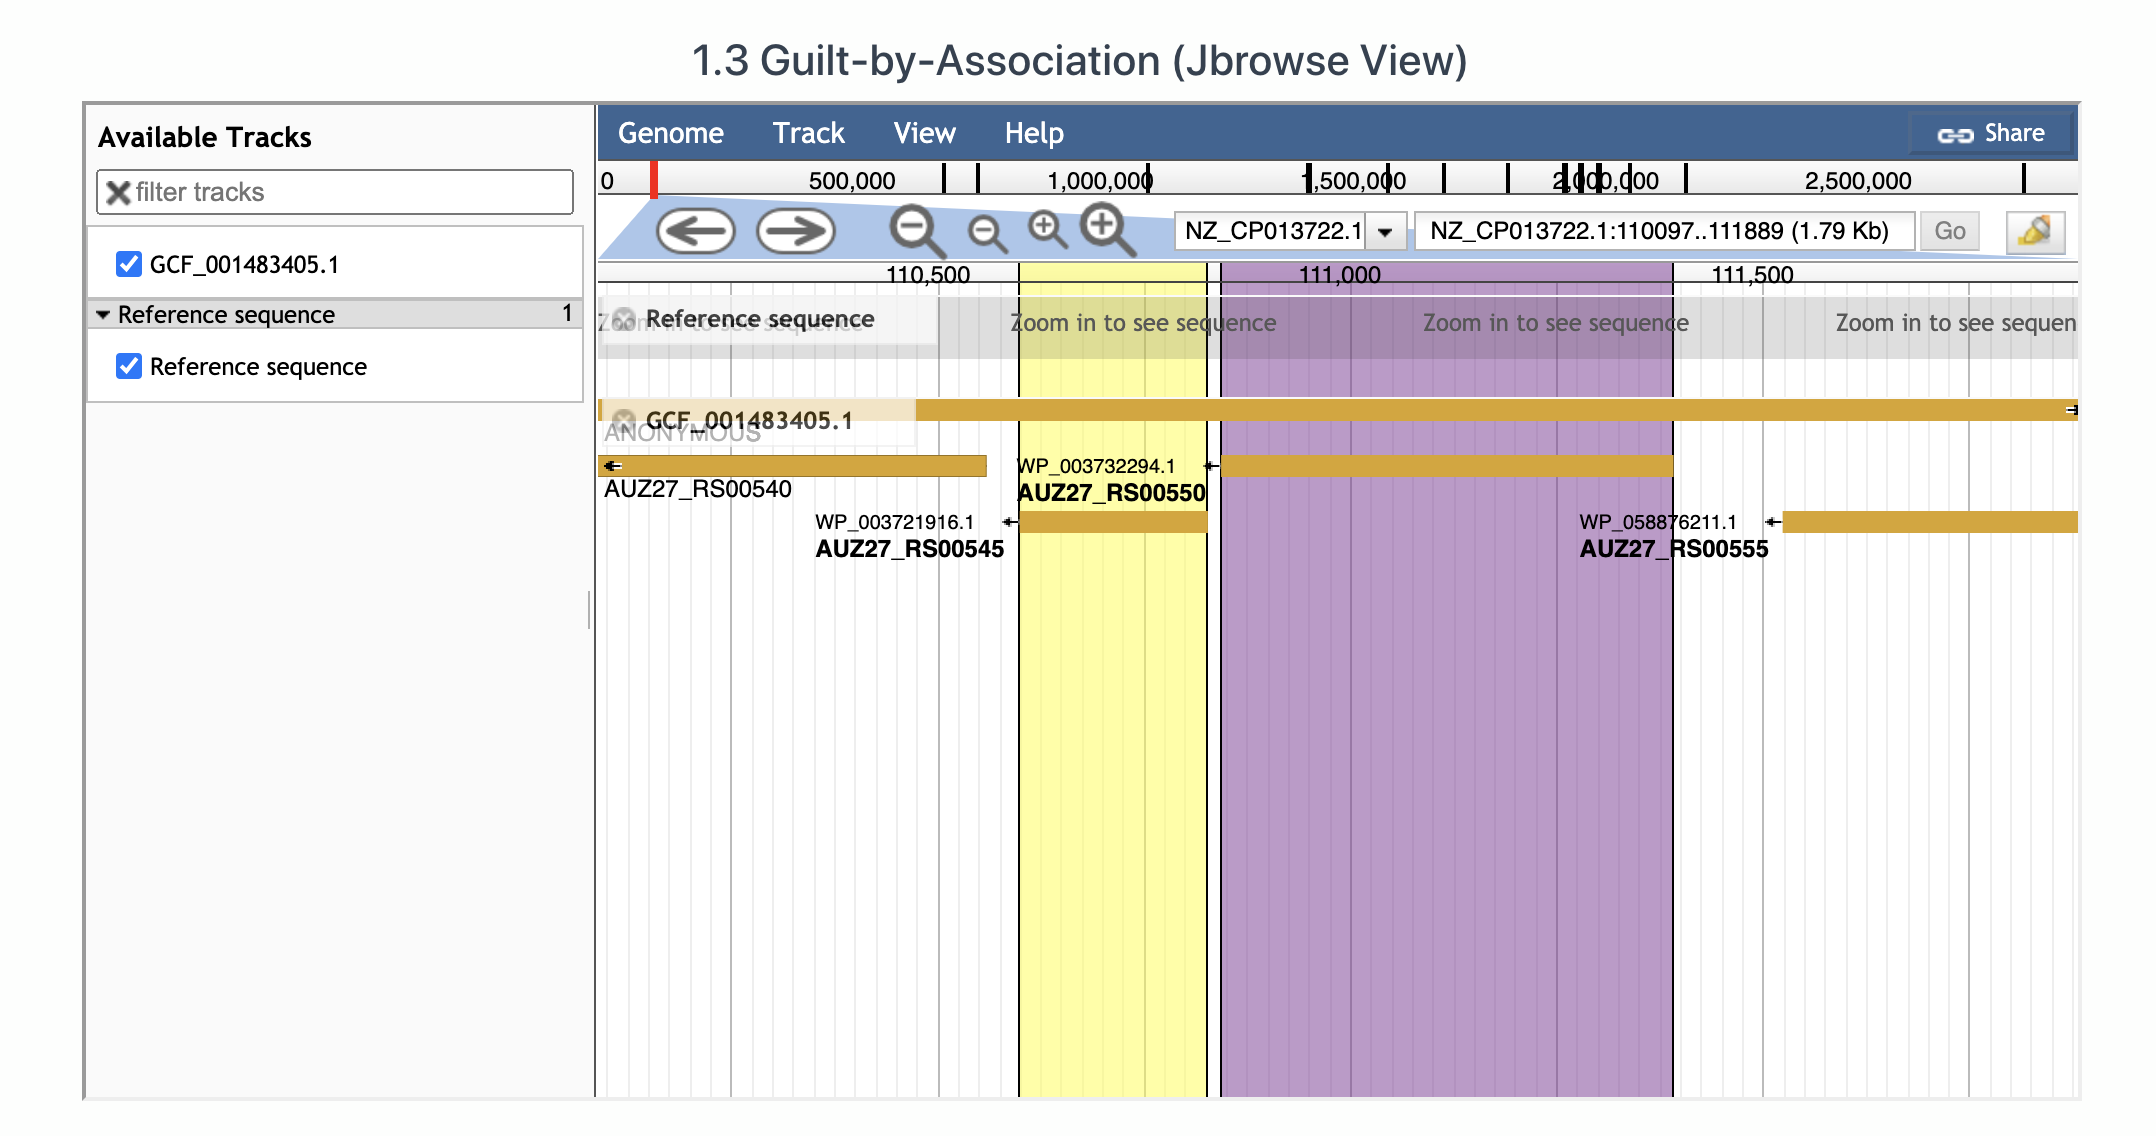
1.3 Jbrowse view for GBA
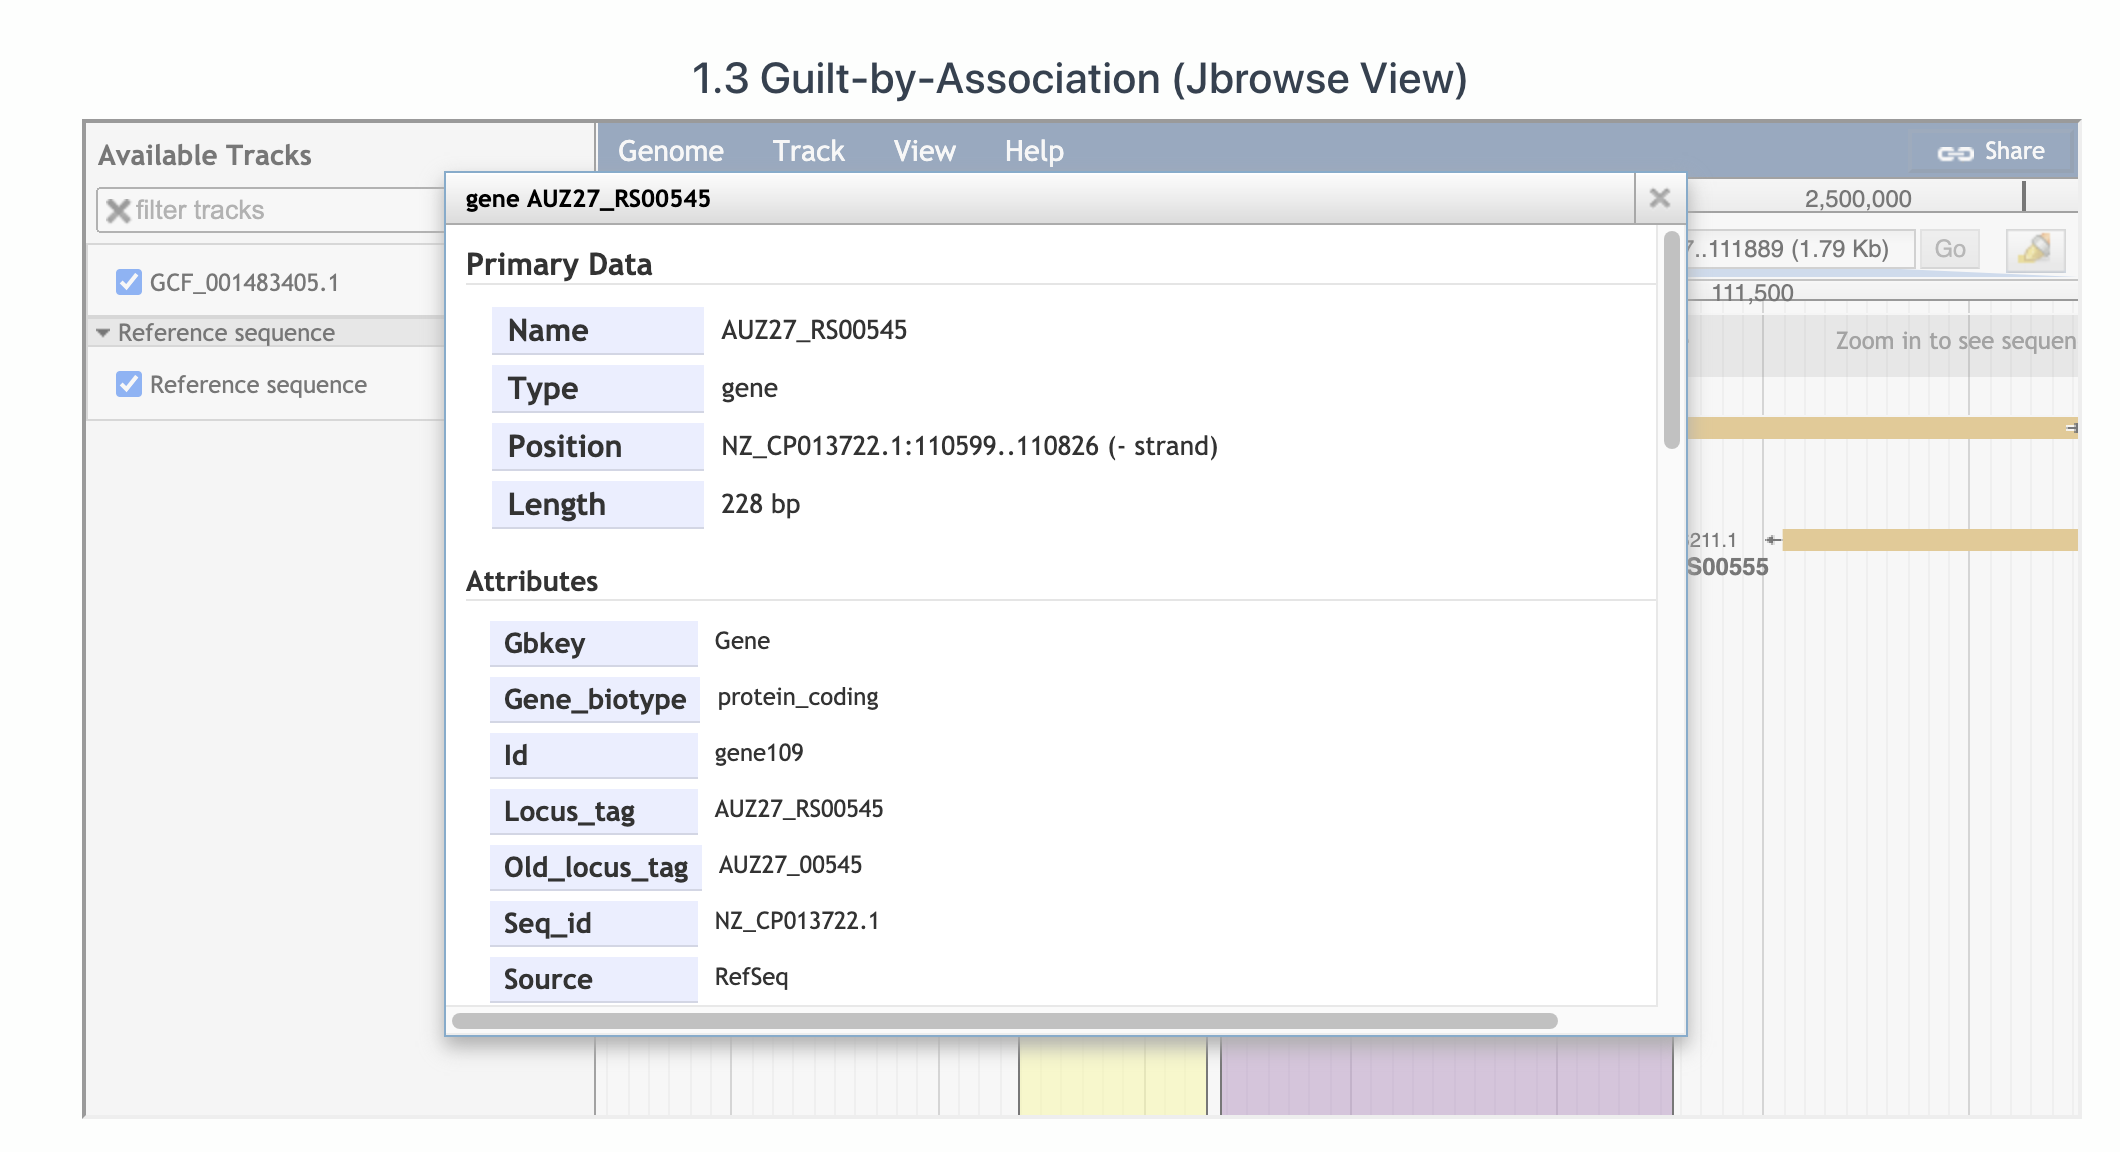
One can also visualize the Acr-Aca loci using JBrowser. In below figure, the Jbrowse presents the first Acr-Aca operon. Aca is in yellow while Acr is in purple. By clicking on the protein, you will see the detailed info which is extracted from the gff file of the genome downloaded from RefSeq database.
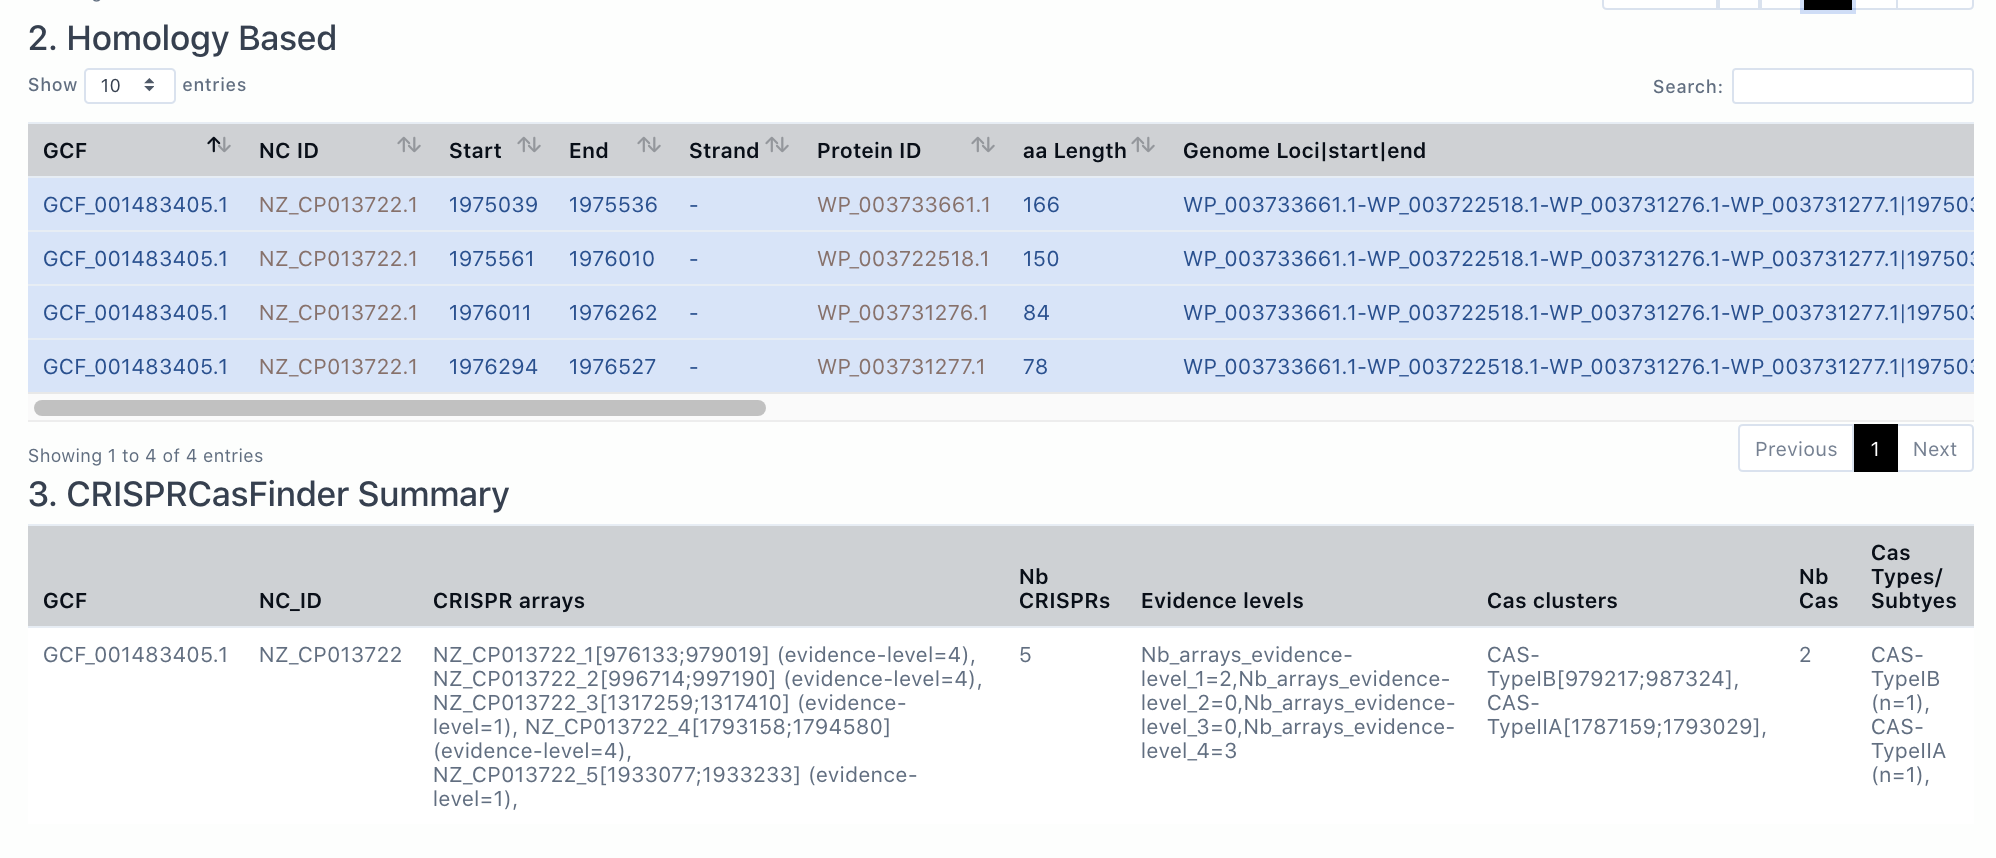
2. Homology based result from AcrFinder
The section is Acr homology based result from AcrFinder (homologs of known Acrs are located in short-gene operons and presented), which are provided in a tabular view as GBA. If the genome does not have Acr homologs, it will say "There is no result by homology based method".

3. CRISPRCasFinder Summary
Here is the CRISPRCasFinder Summary produced by CRISPRCasFinder. In this page, we only present the summery where the CRISPR array column and the Cas clusters are not empty (i.e., level 3 and 4 of CRISPRCasFinder predictions).

Download page
We provide batch downlaod function for users.