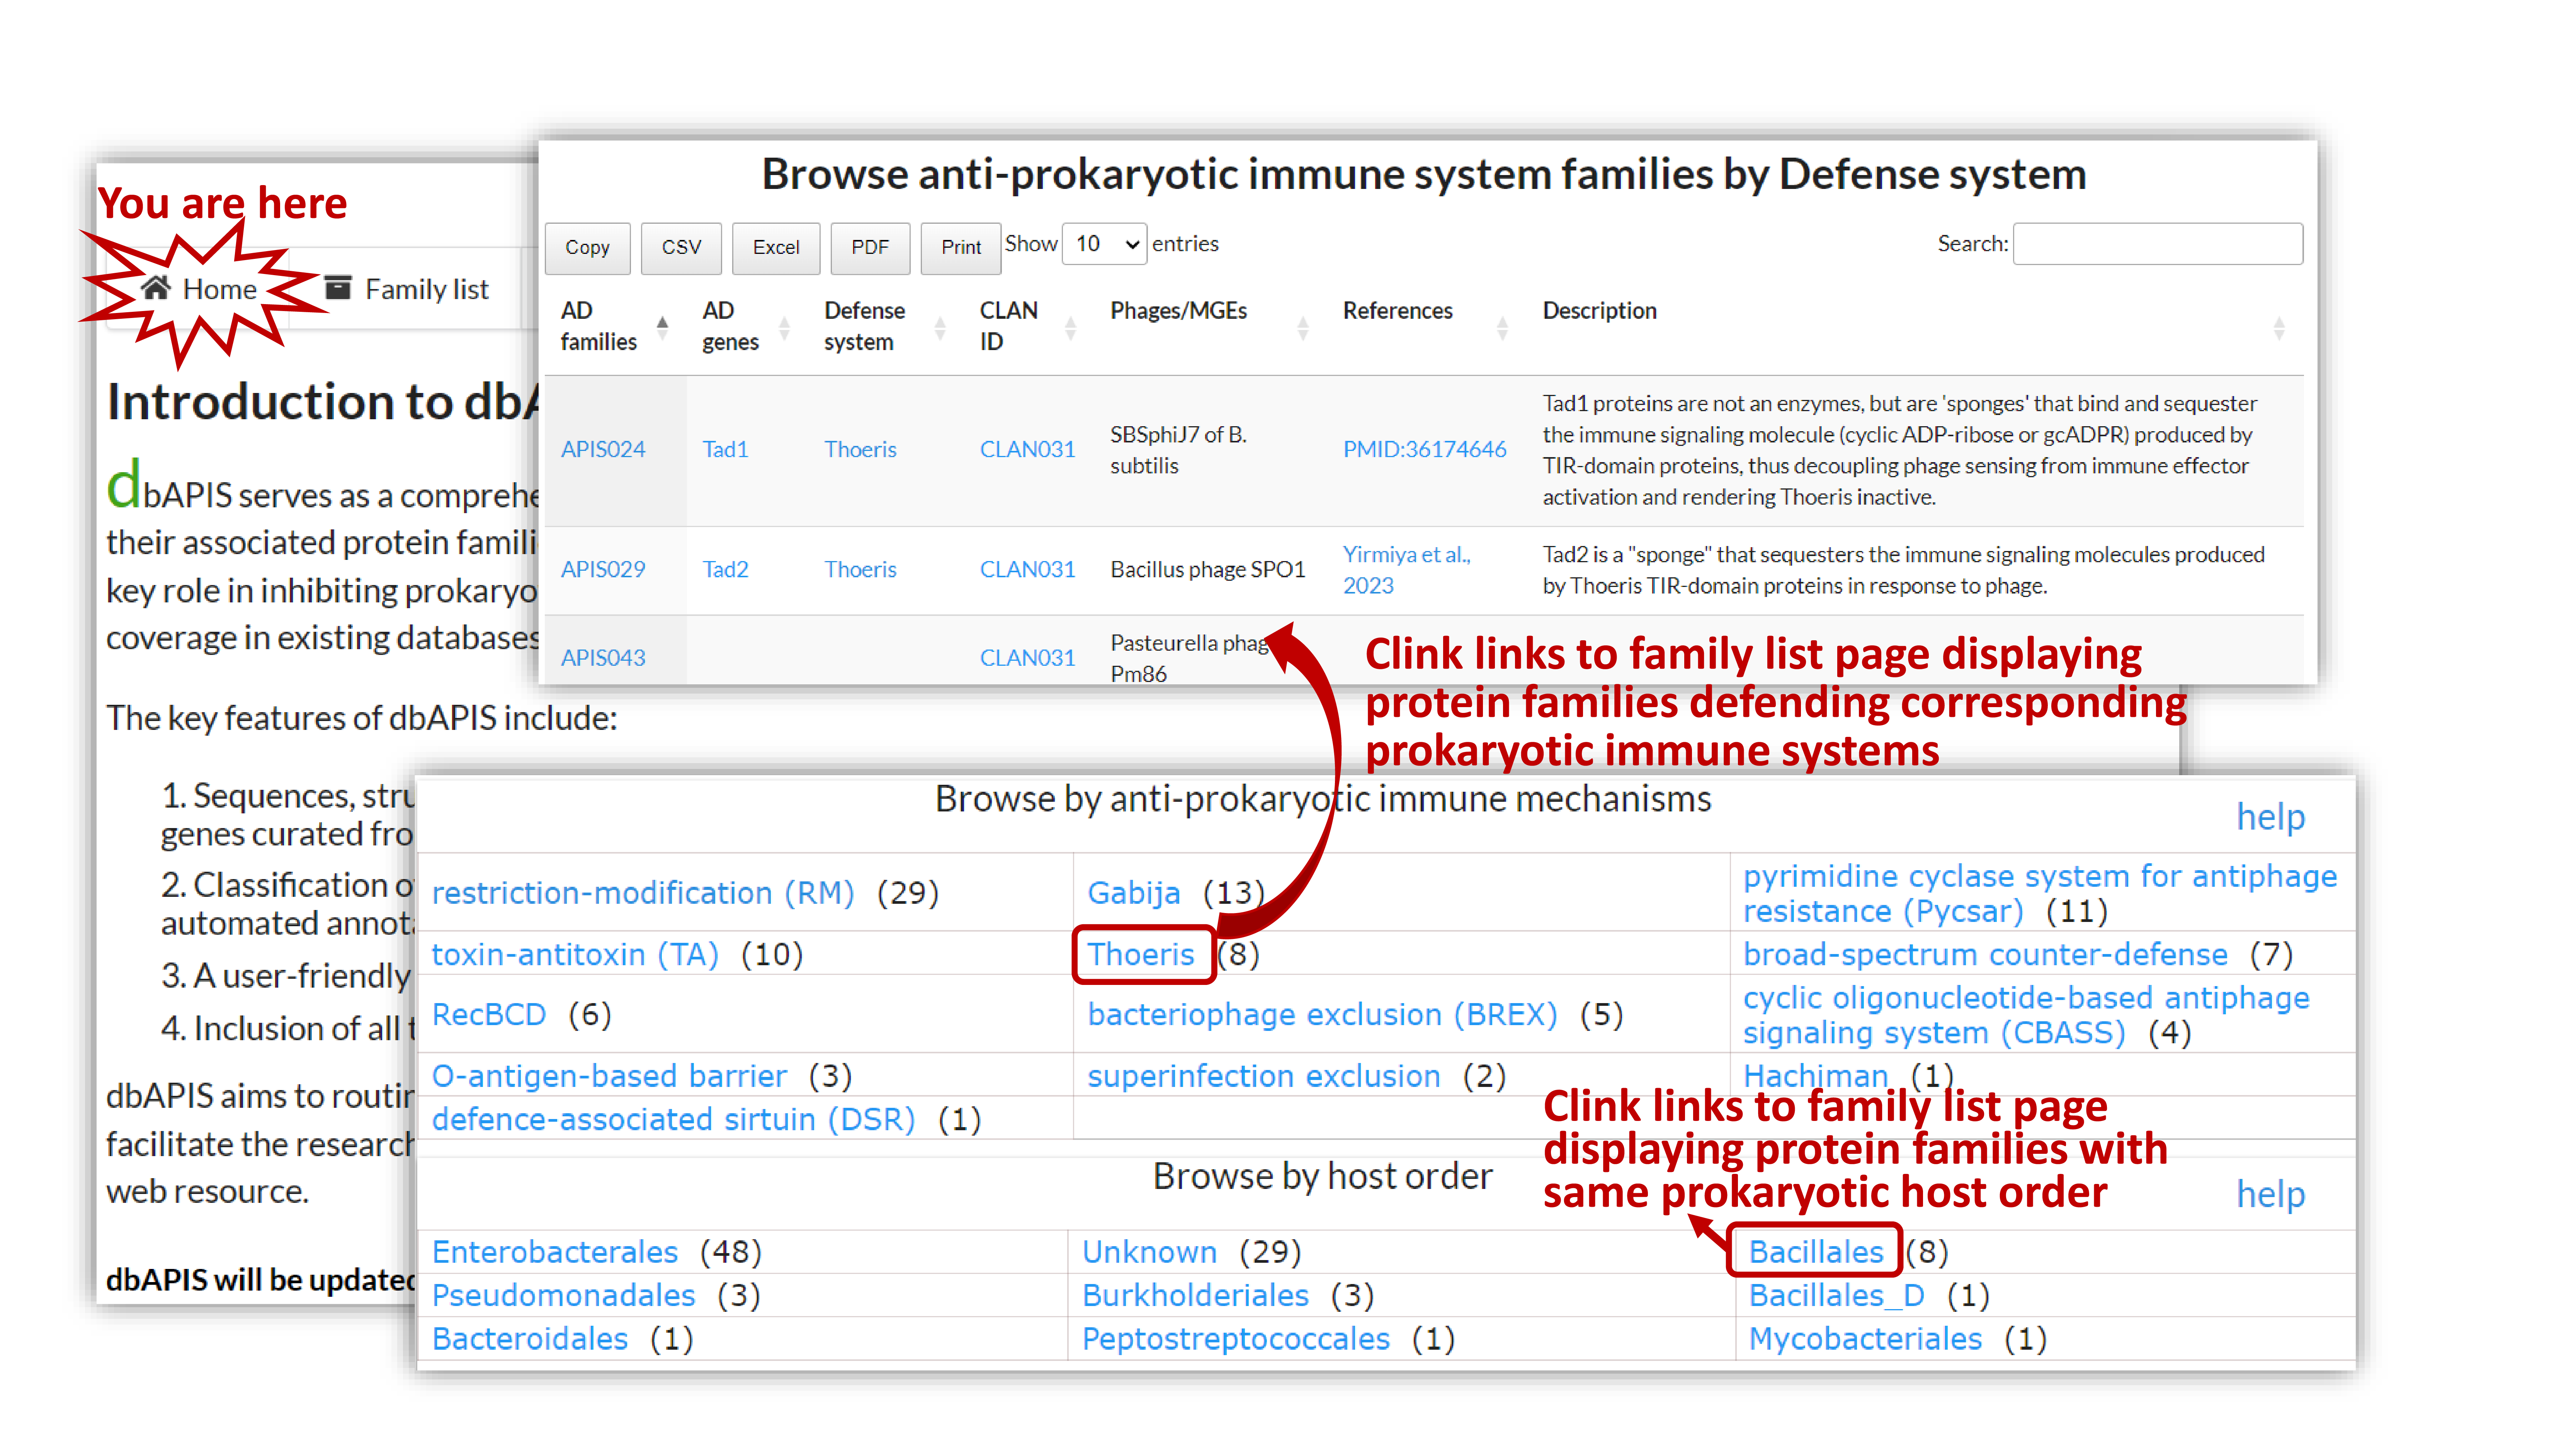
The Home page provides browser by prokaryotic immune mechanisms and host orders.
Users can click on the links and be redirected to the family list page displaying protein families filtered with the matching term.
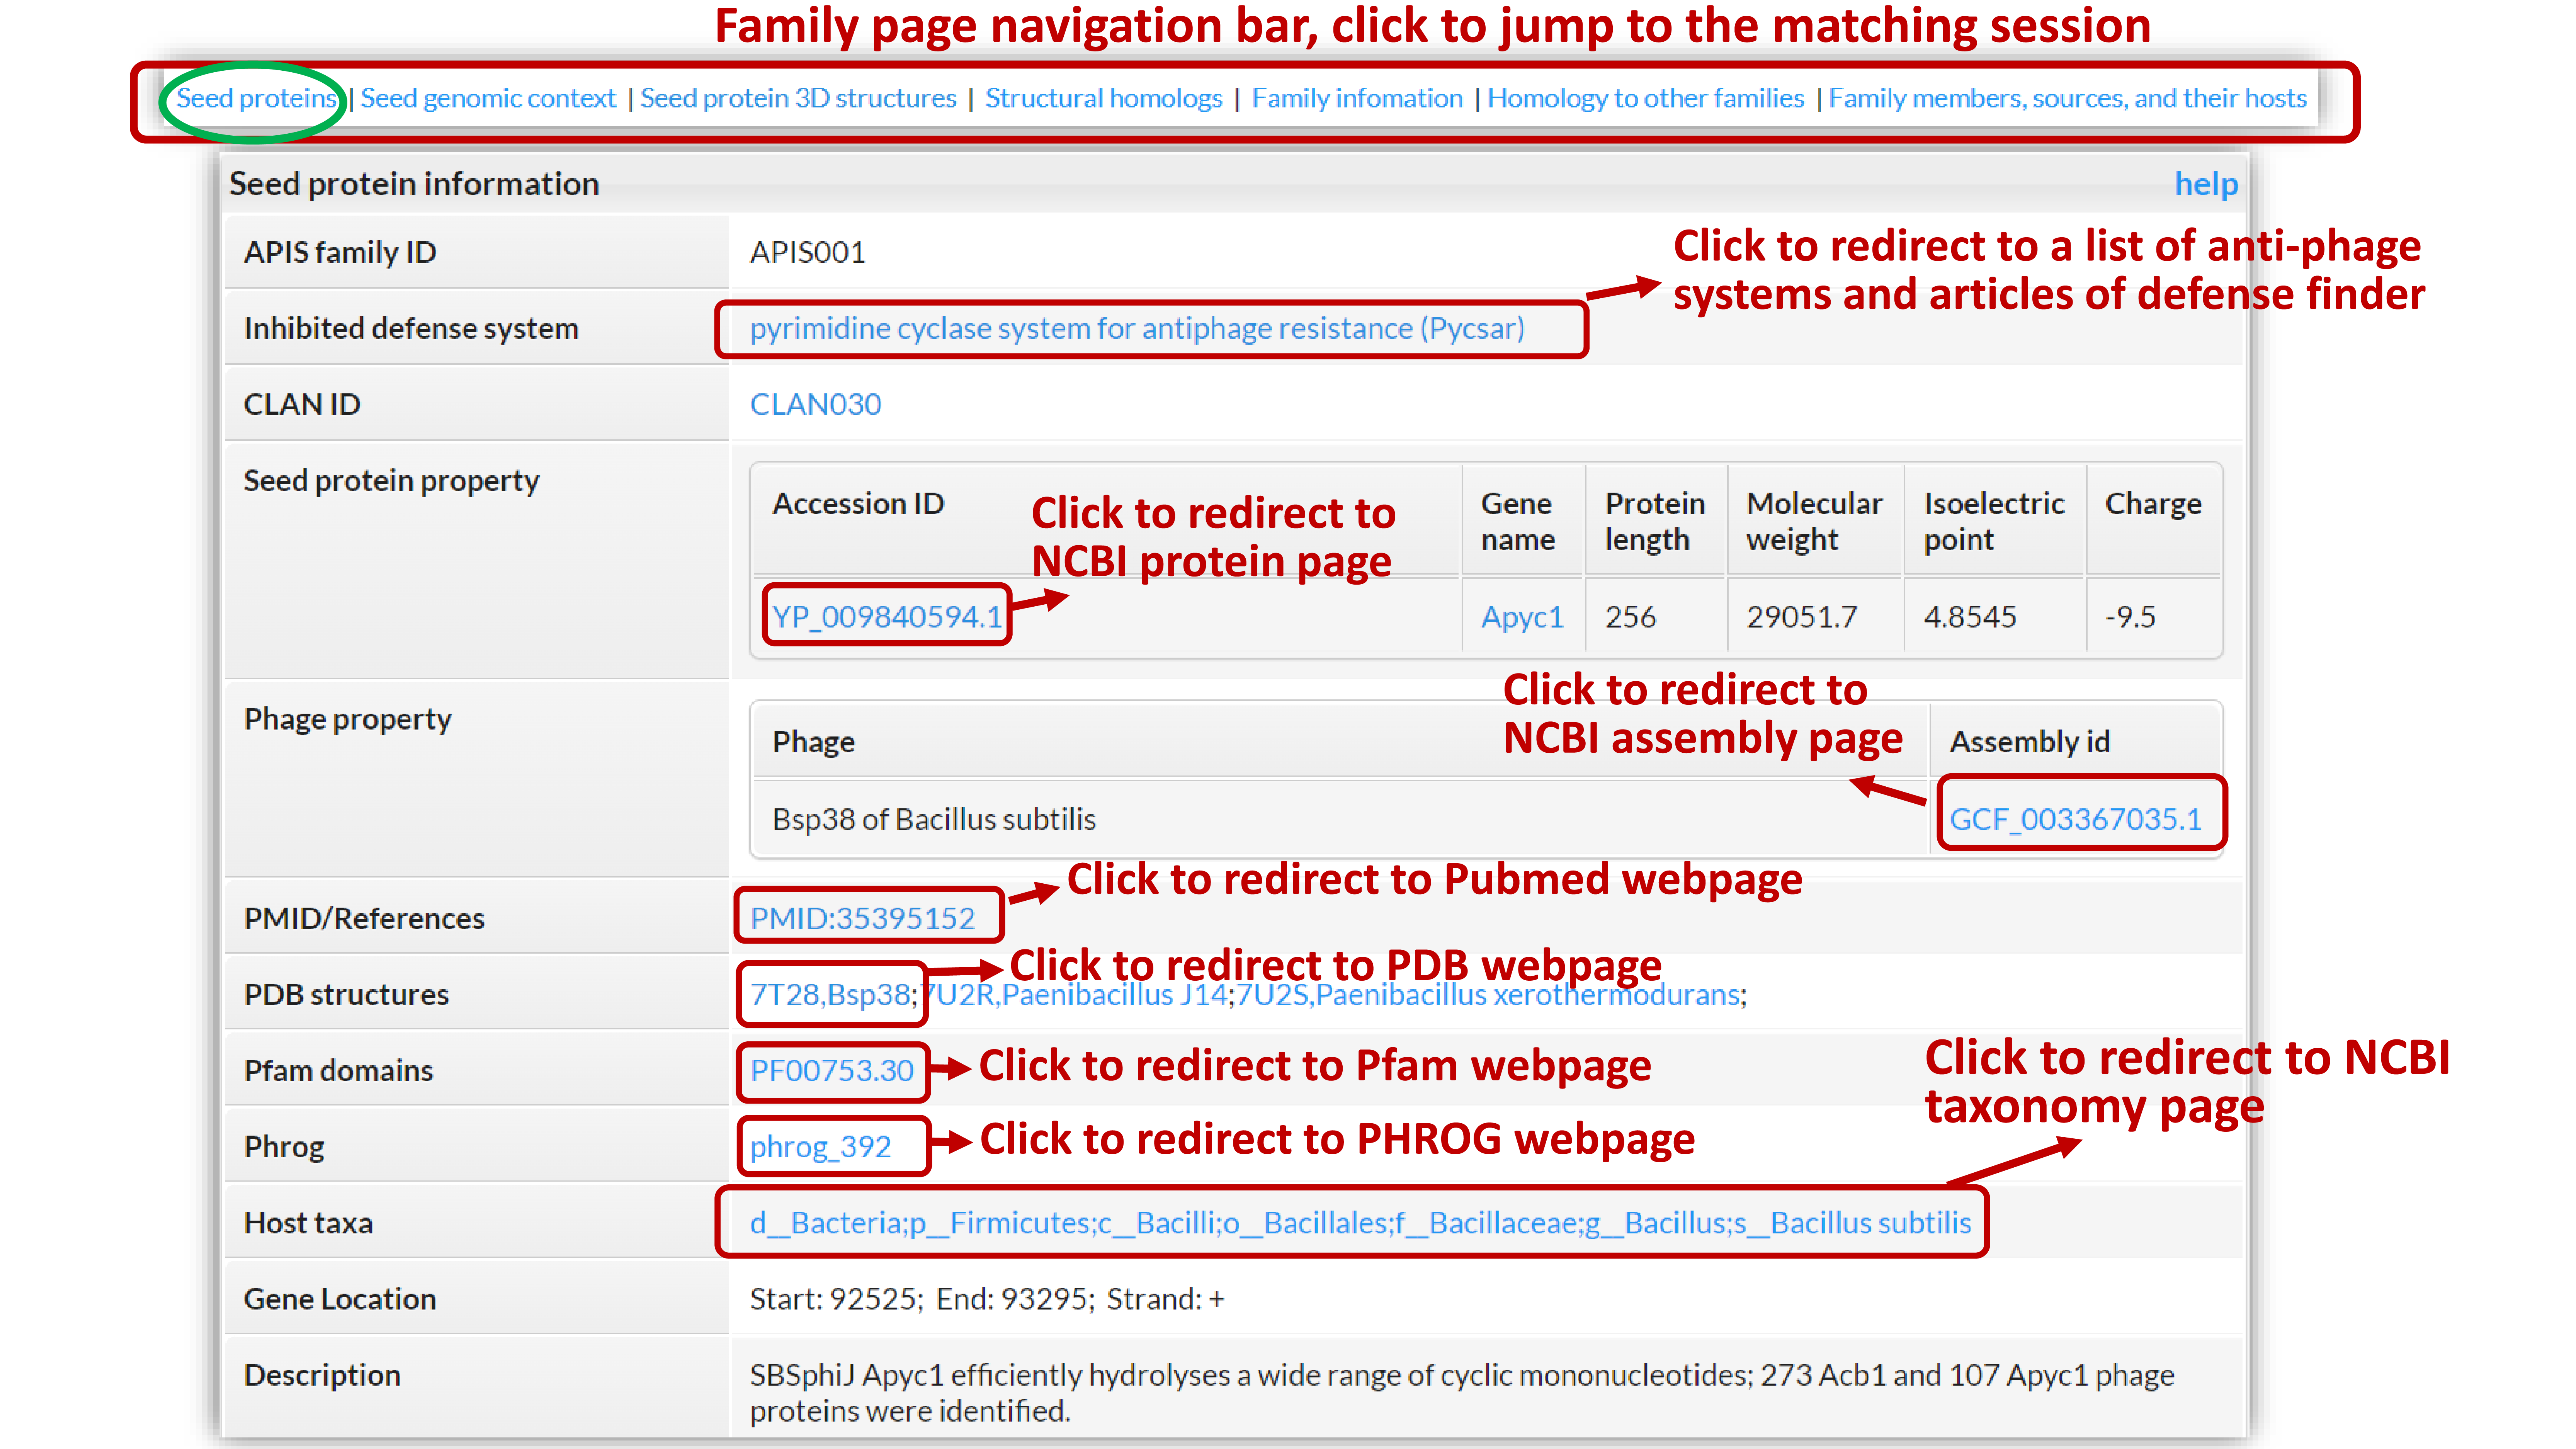
Metadata and basic information about the seed protein of the family.
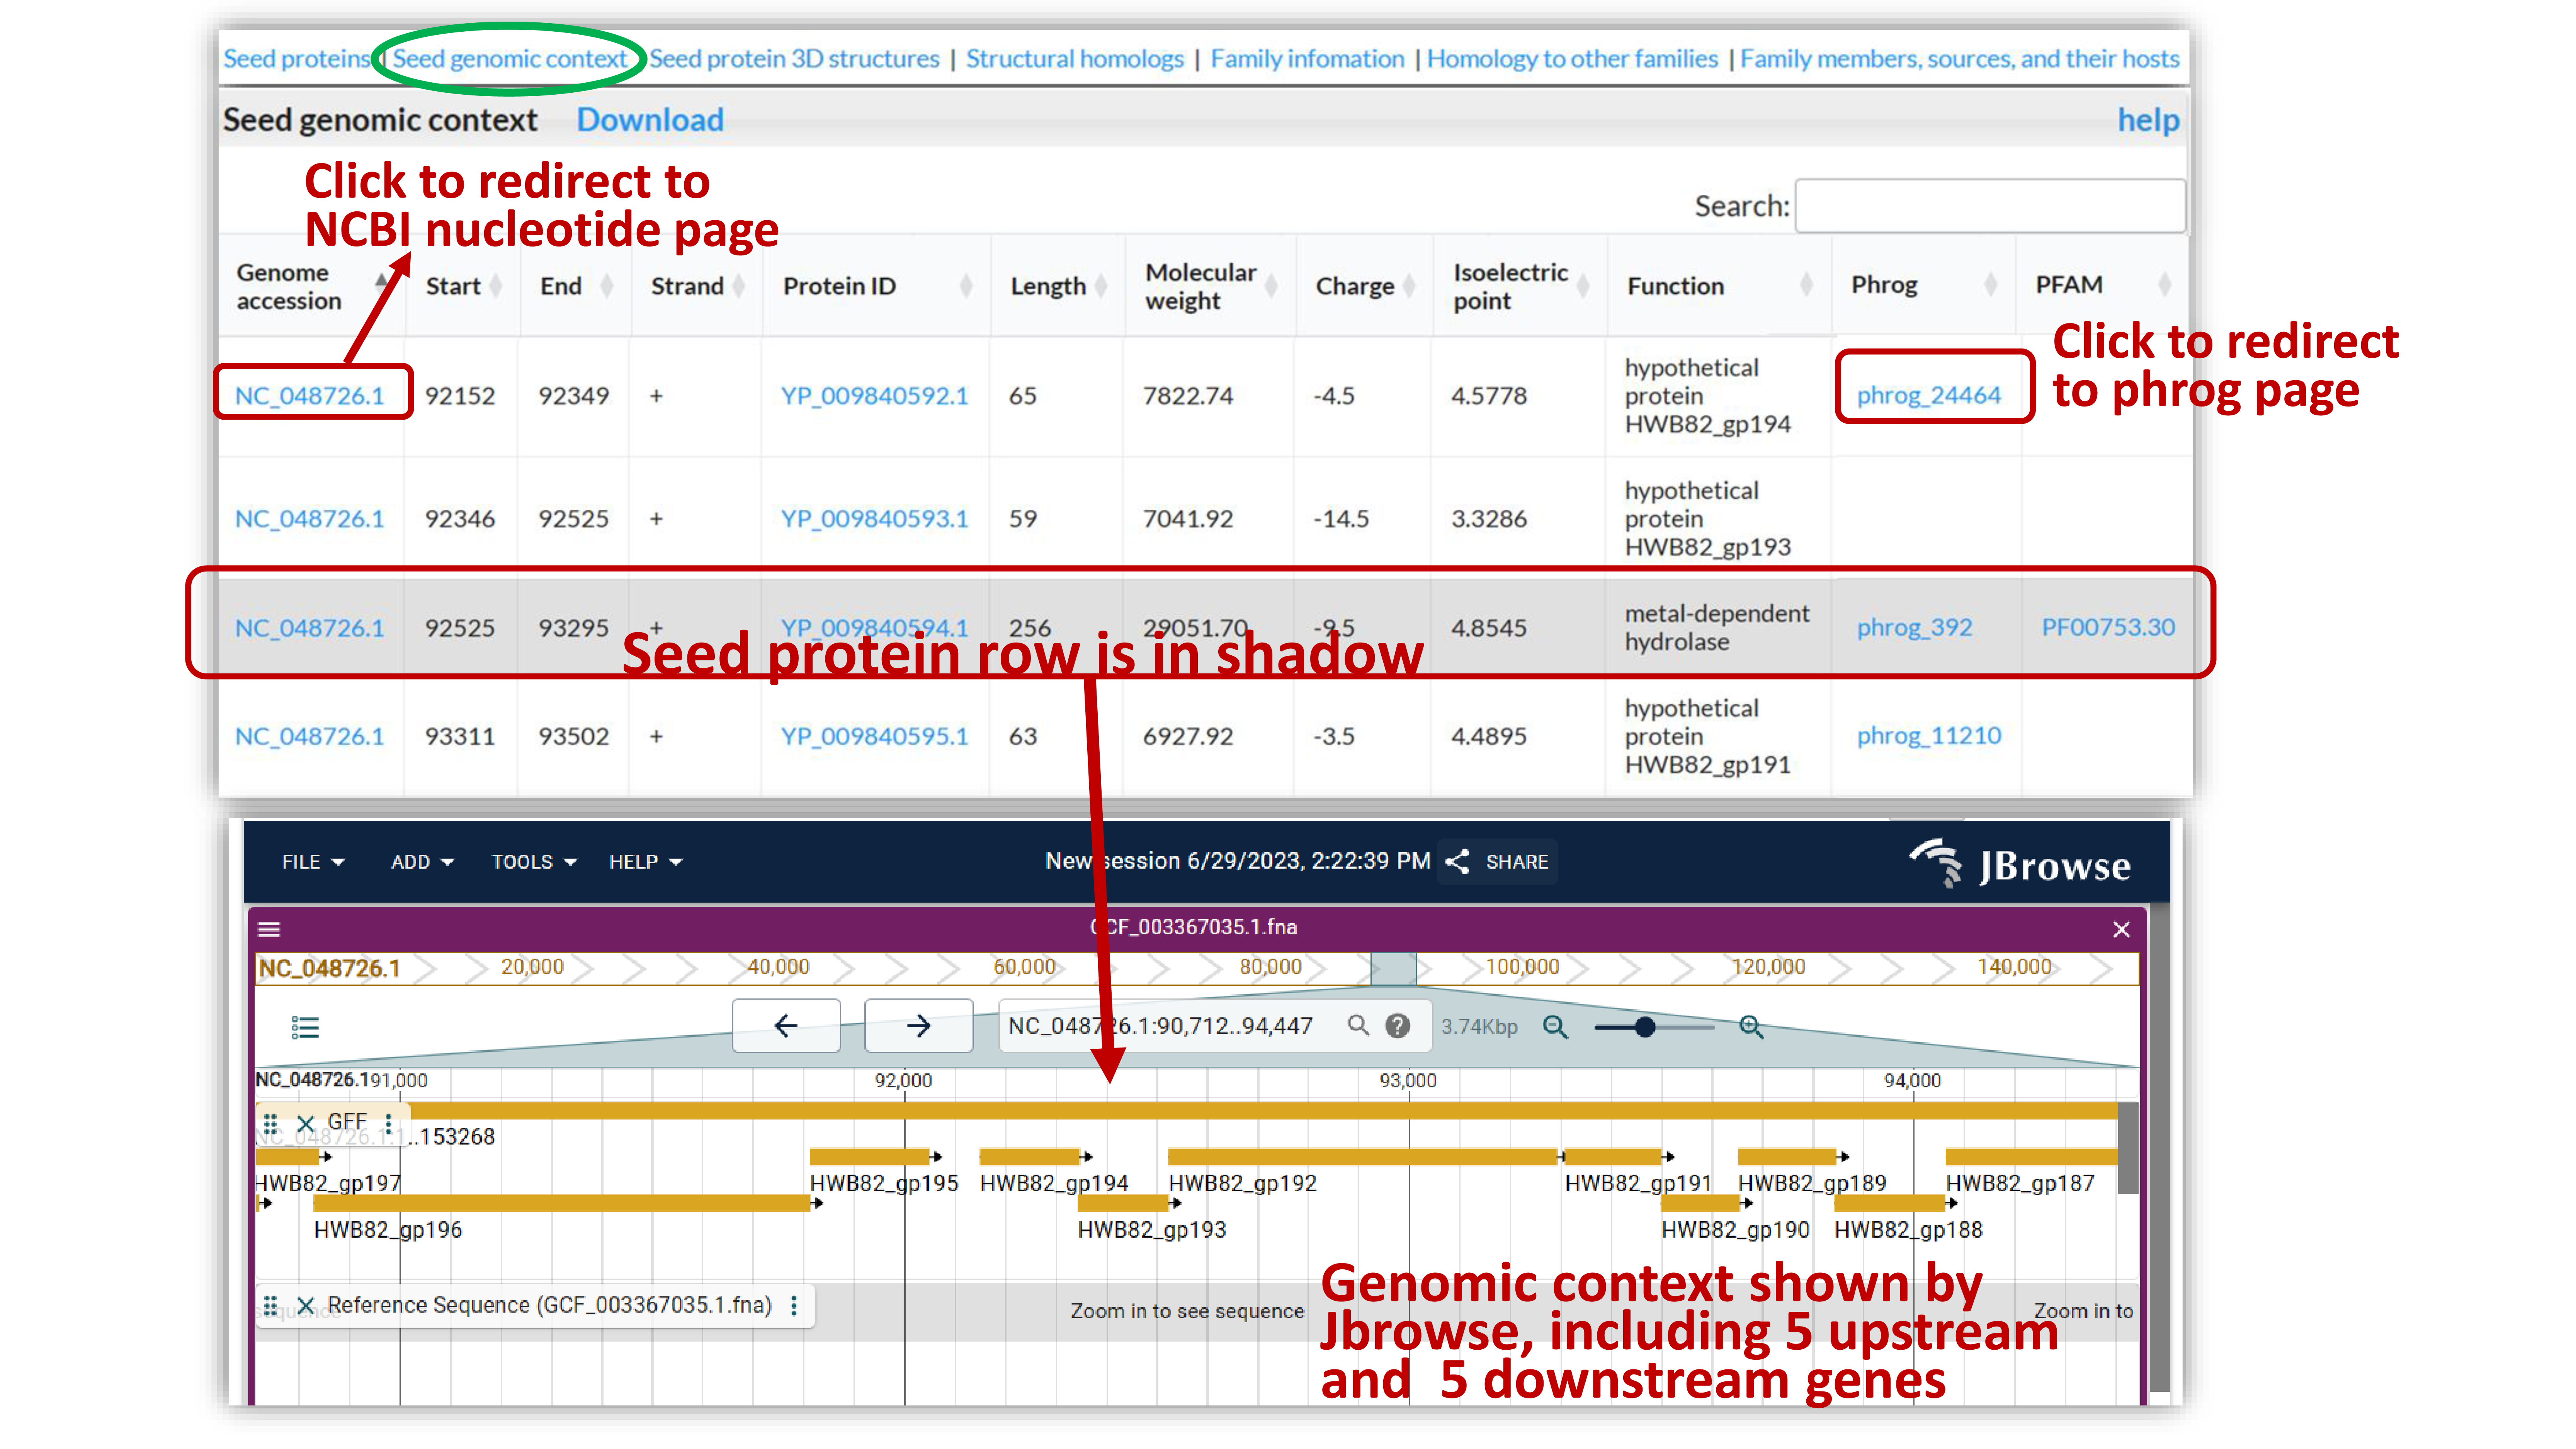
Gene information of the seed protein along with its five upstream and five downstream genes is provided, including location, strand, sequence length, molecular weight, charge, isoelectric point, Phrog and Pfam annotation, as well as genomic context visualization using JBrowser. Some families do not have this part due to genomic context data incompleteness.
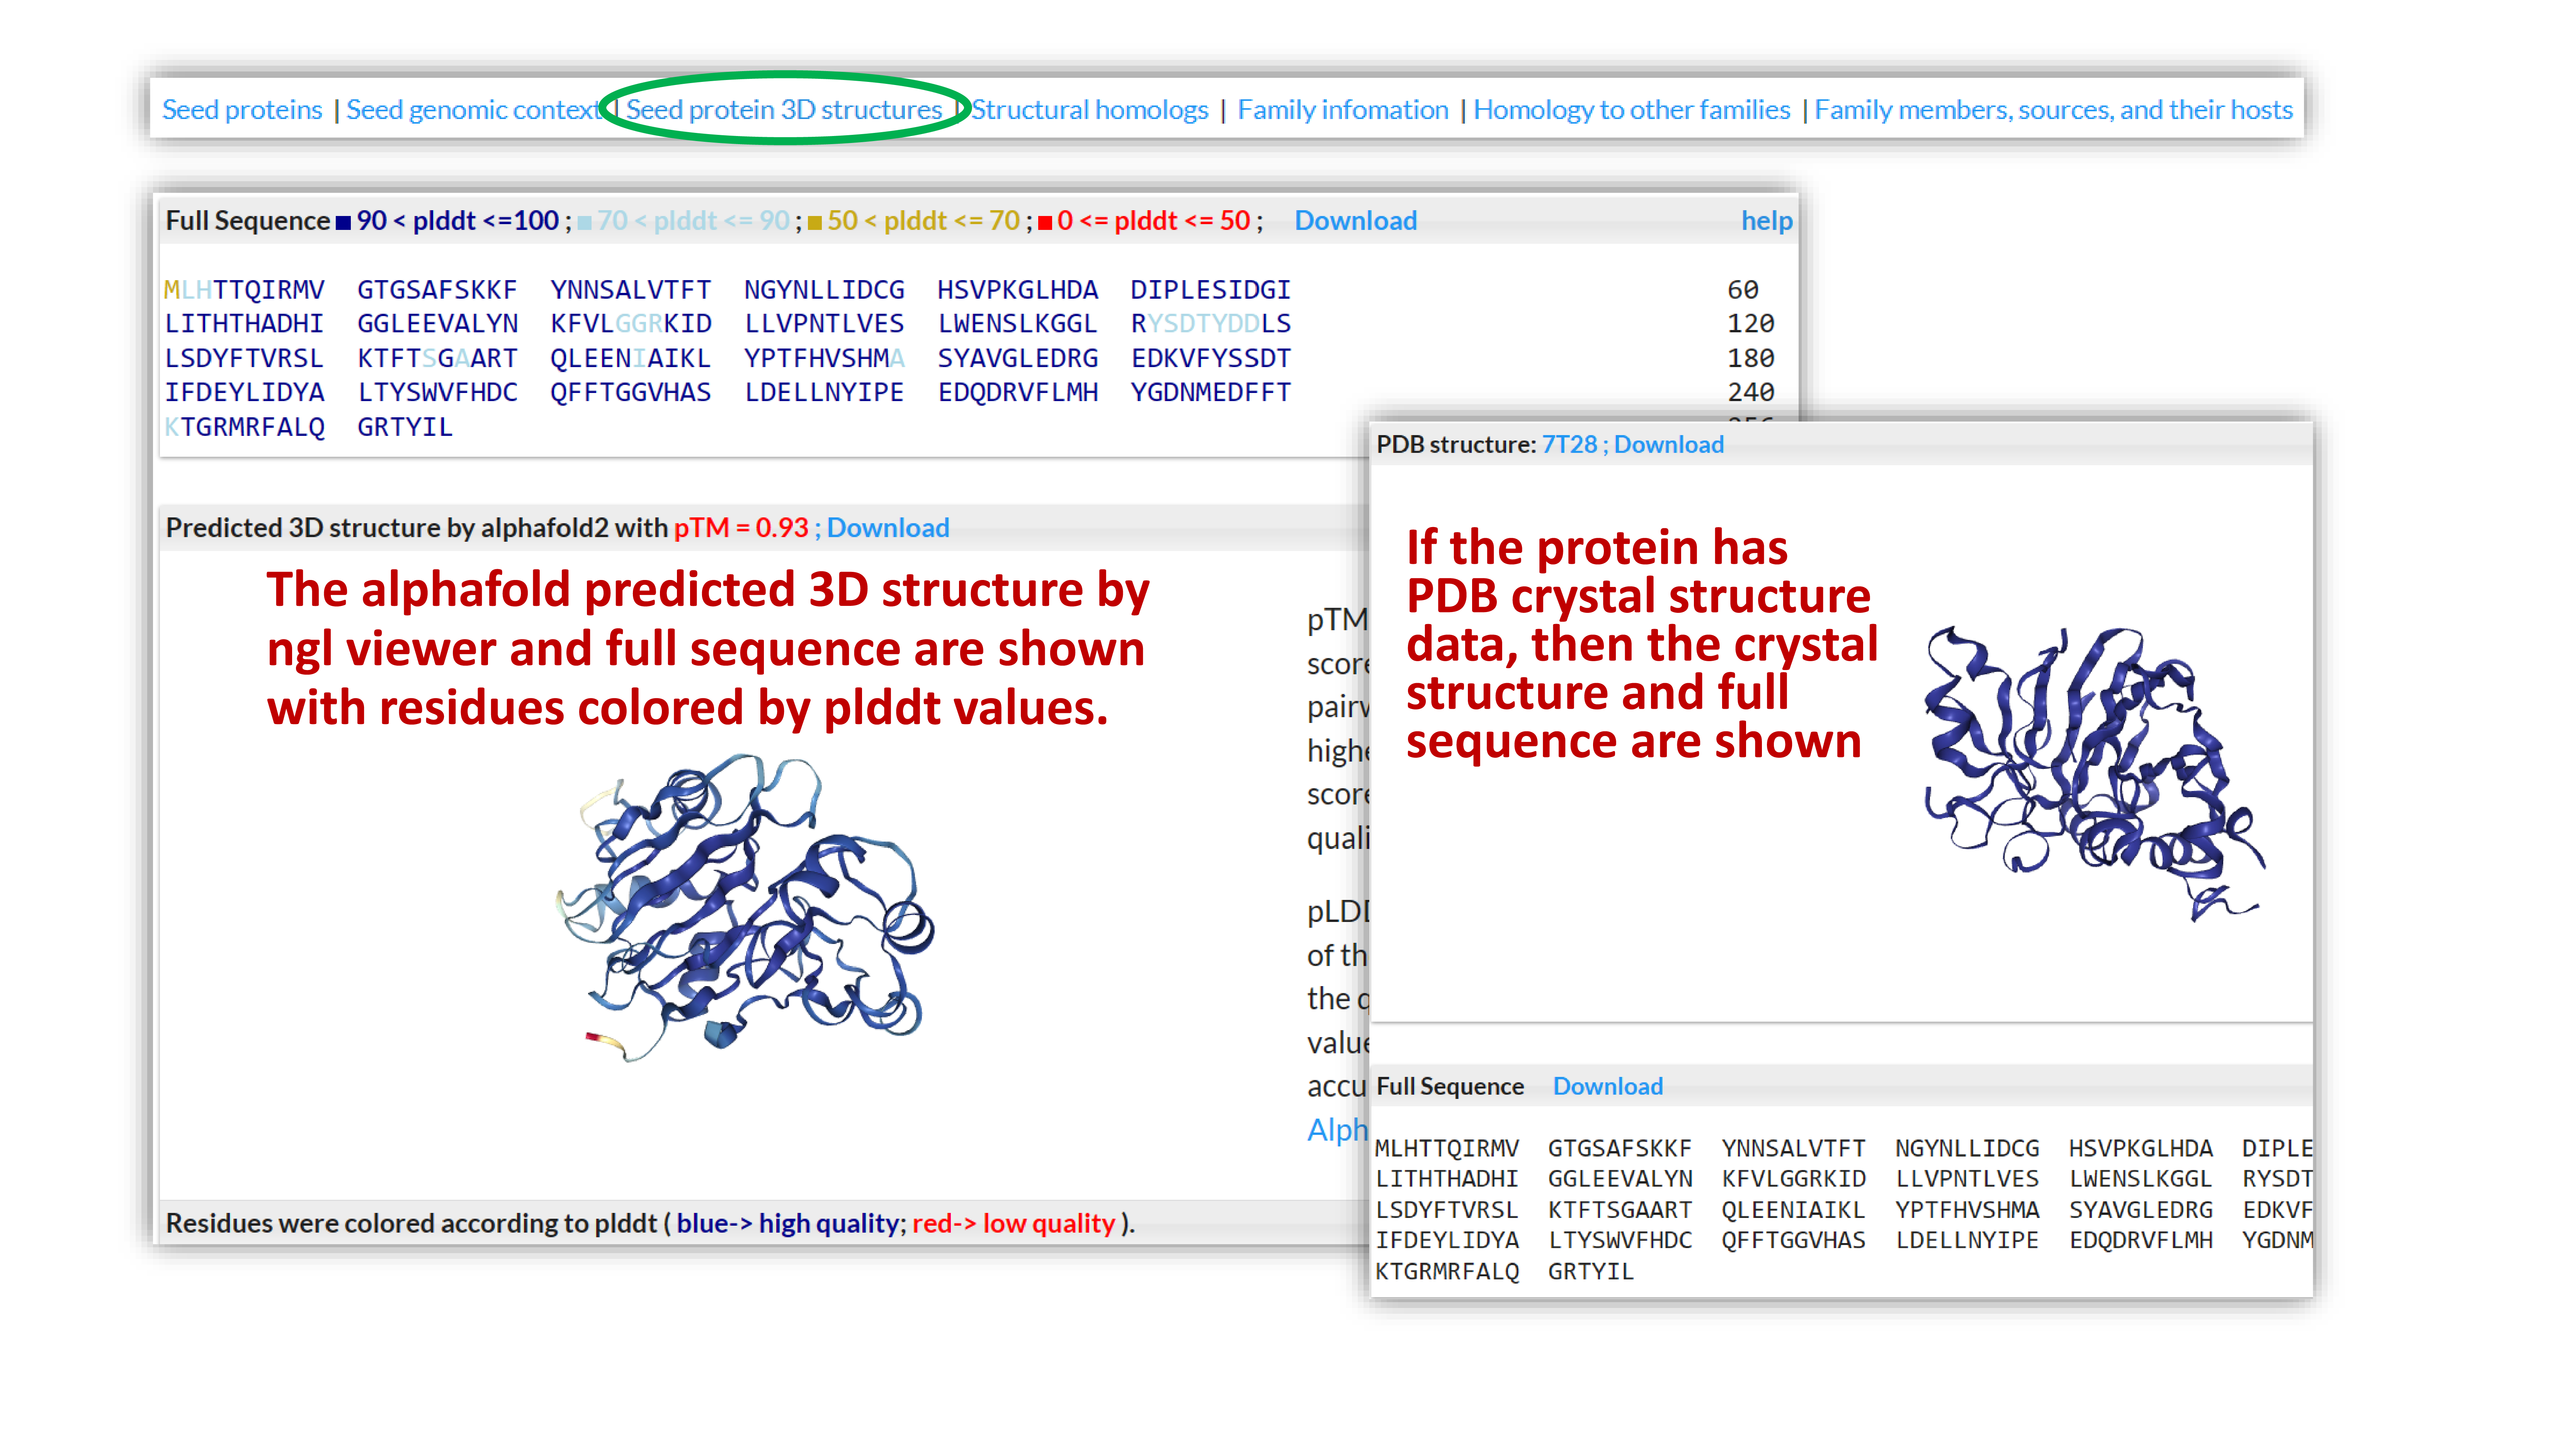
If the protein has crystal structure information, then the crystal structure and full sequence are shown; if not, the AlphaFold predicted 3D structure by ngl viewer and full sequence are shown with residues colored by plddt values.
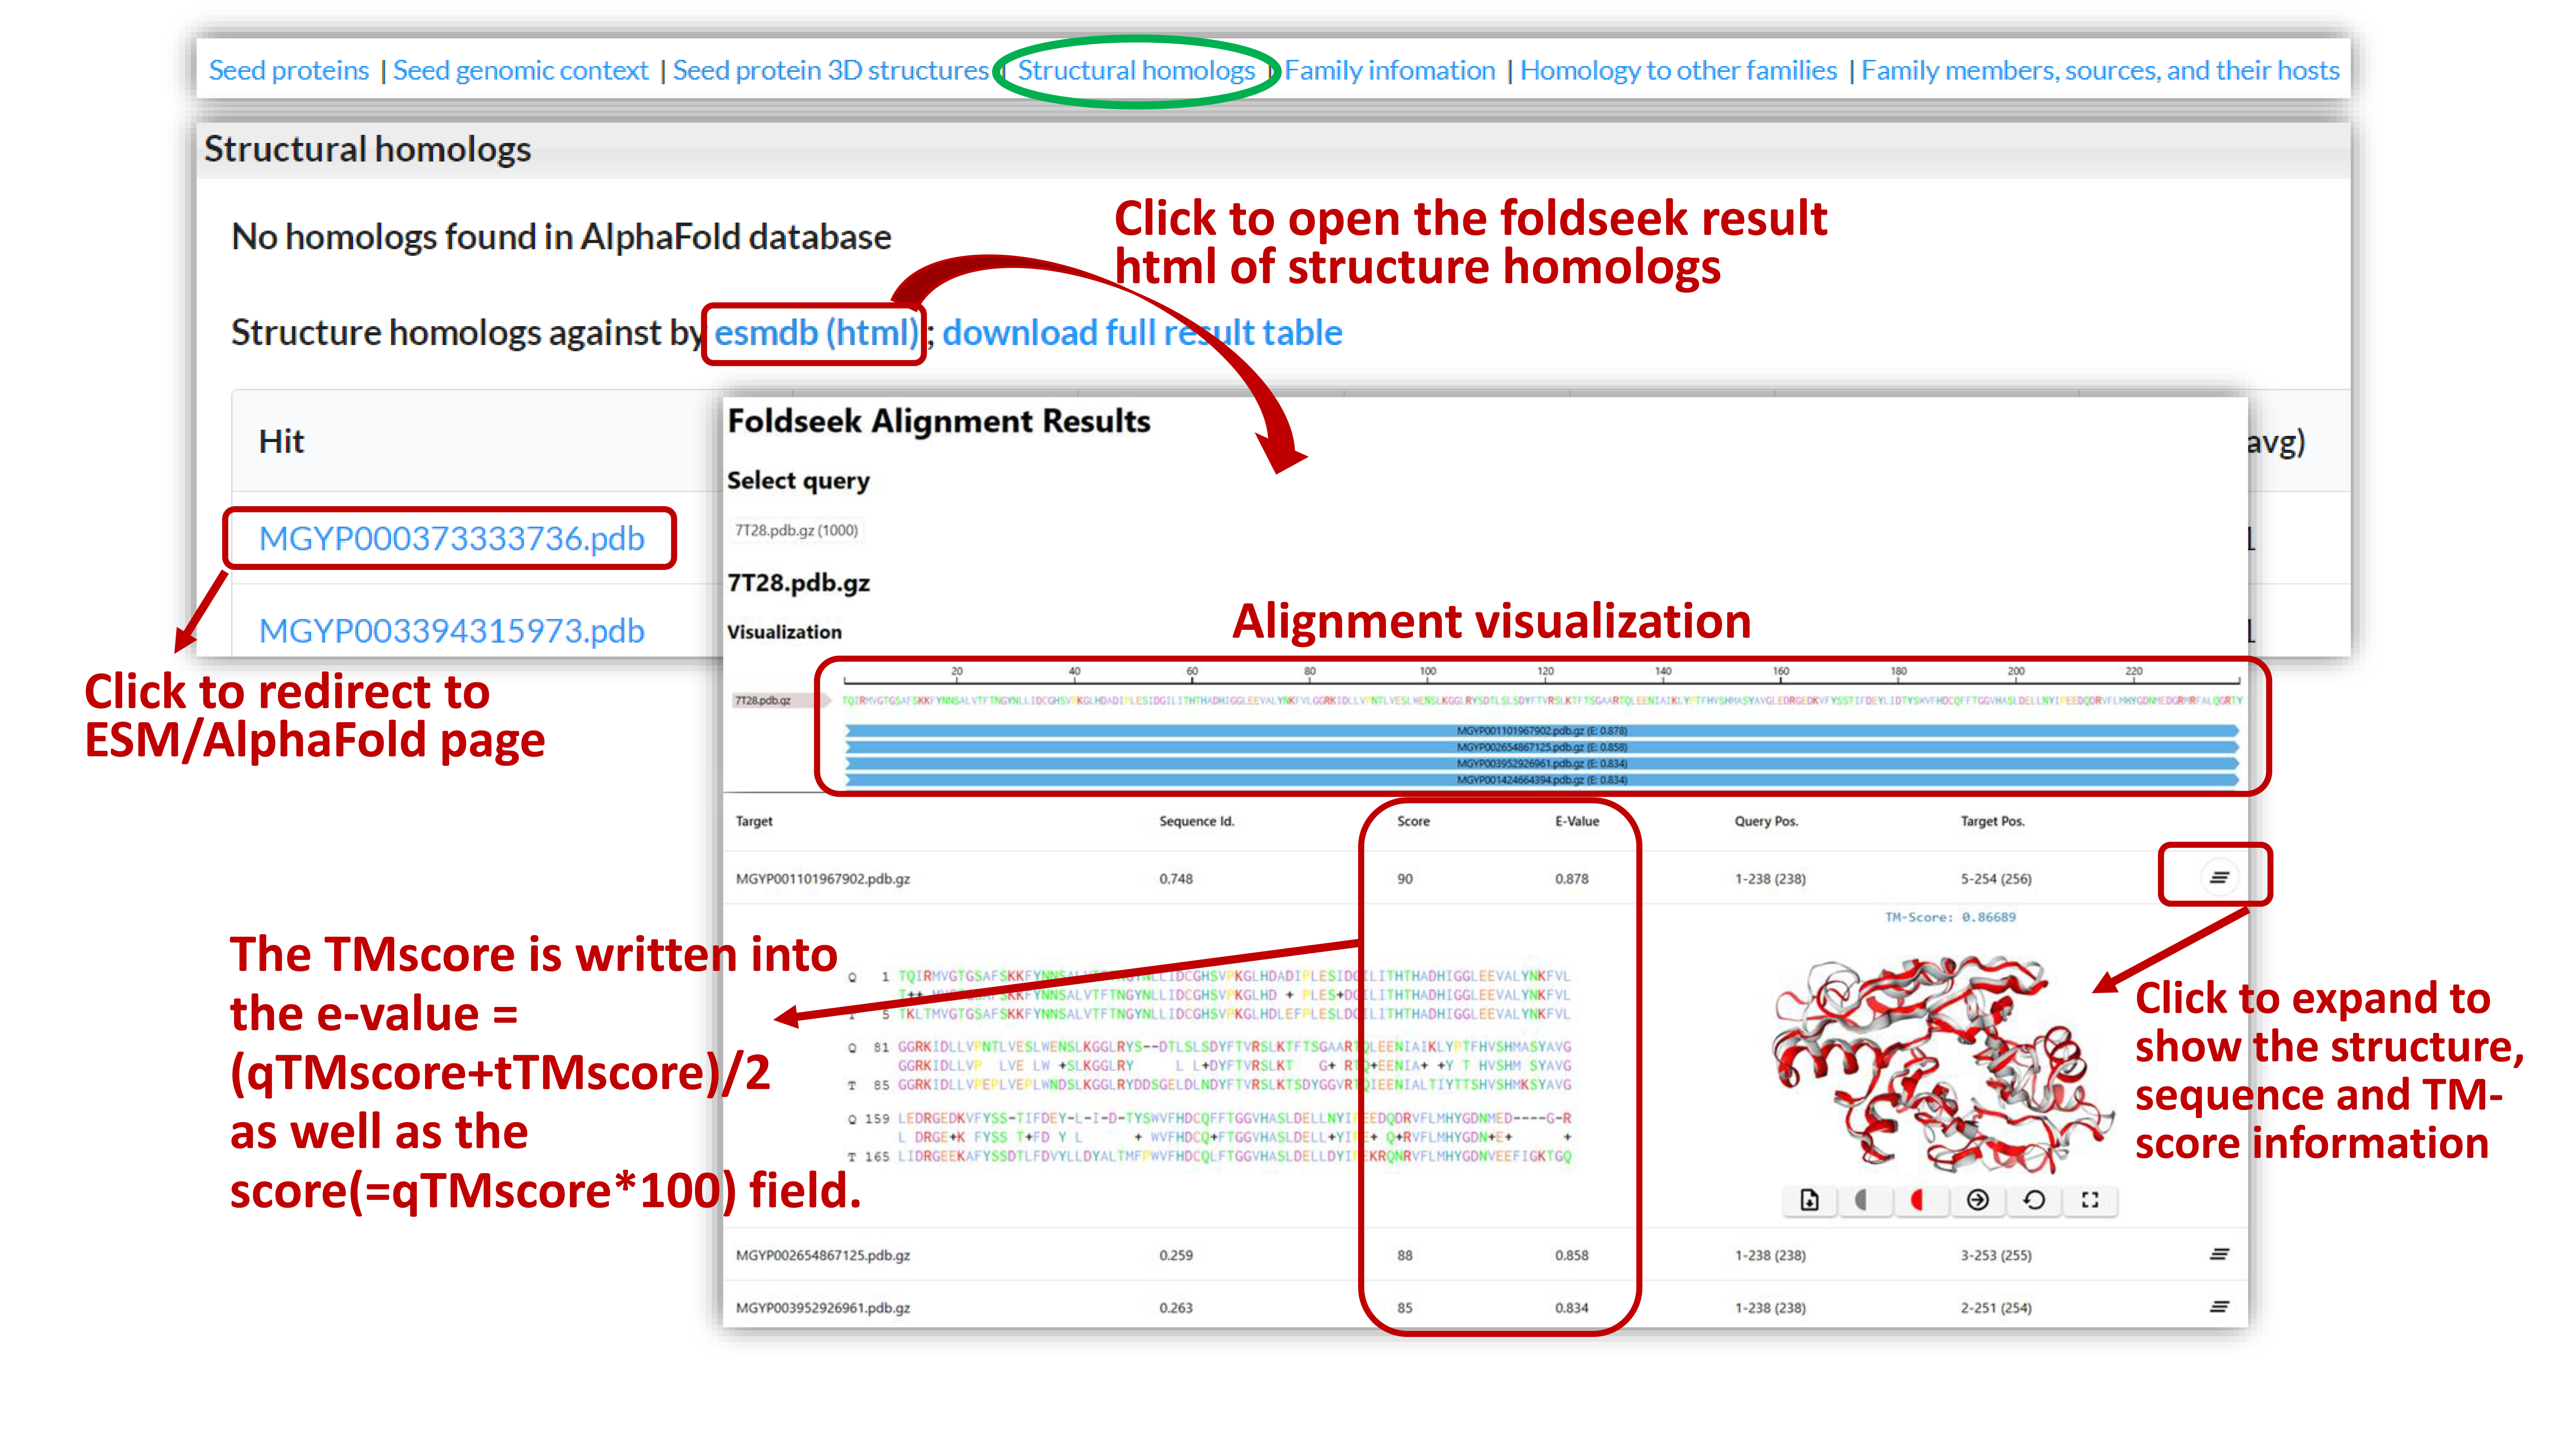
We use TMalign in foldseek to search against AlphaFold and ESM Metagenomic Atlas database for protein structure homologs. Clicking on the links to view the results in HTML format. The foldseek sorts the results by the TMscore normalized by query length. The TM-score is written into the e-value =(qTMscore+tTMscore)/2 as well as the score(=qTMscore*100) field.
The protein sequence in fasta format, multiple sequence alignment and HMM model of the family are provided for downloading. The distribution of member host and sequence length is represented visually through plots.

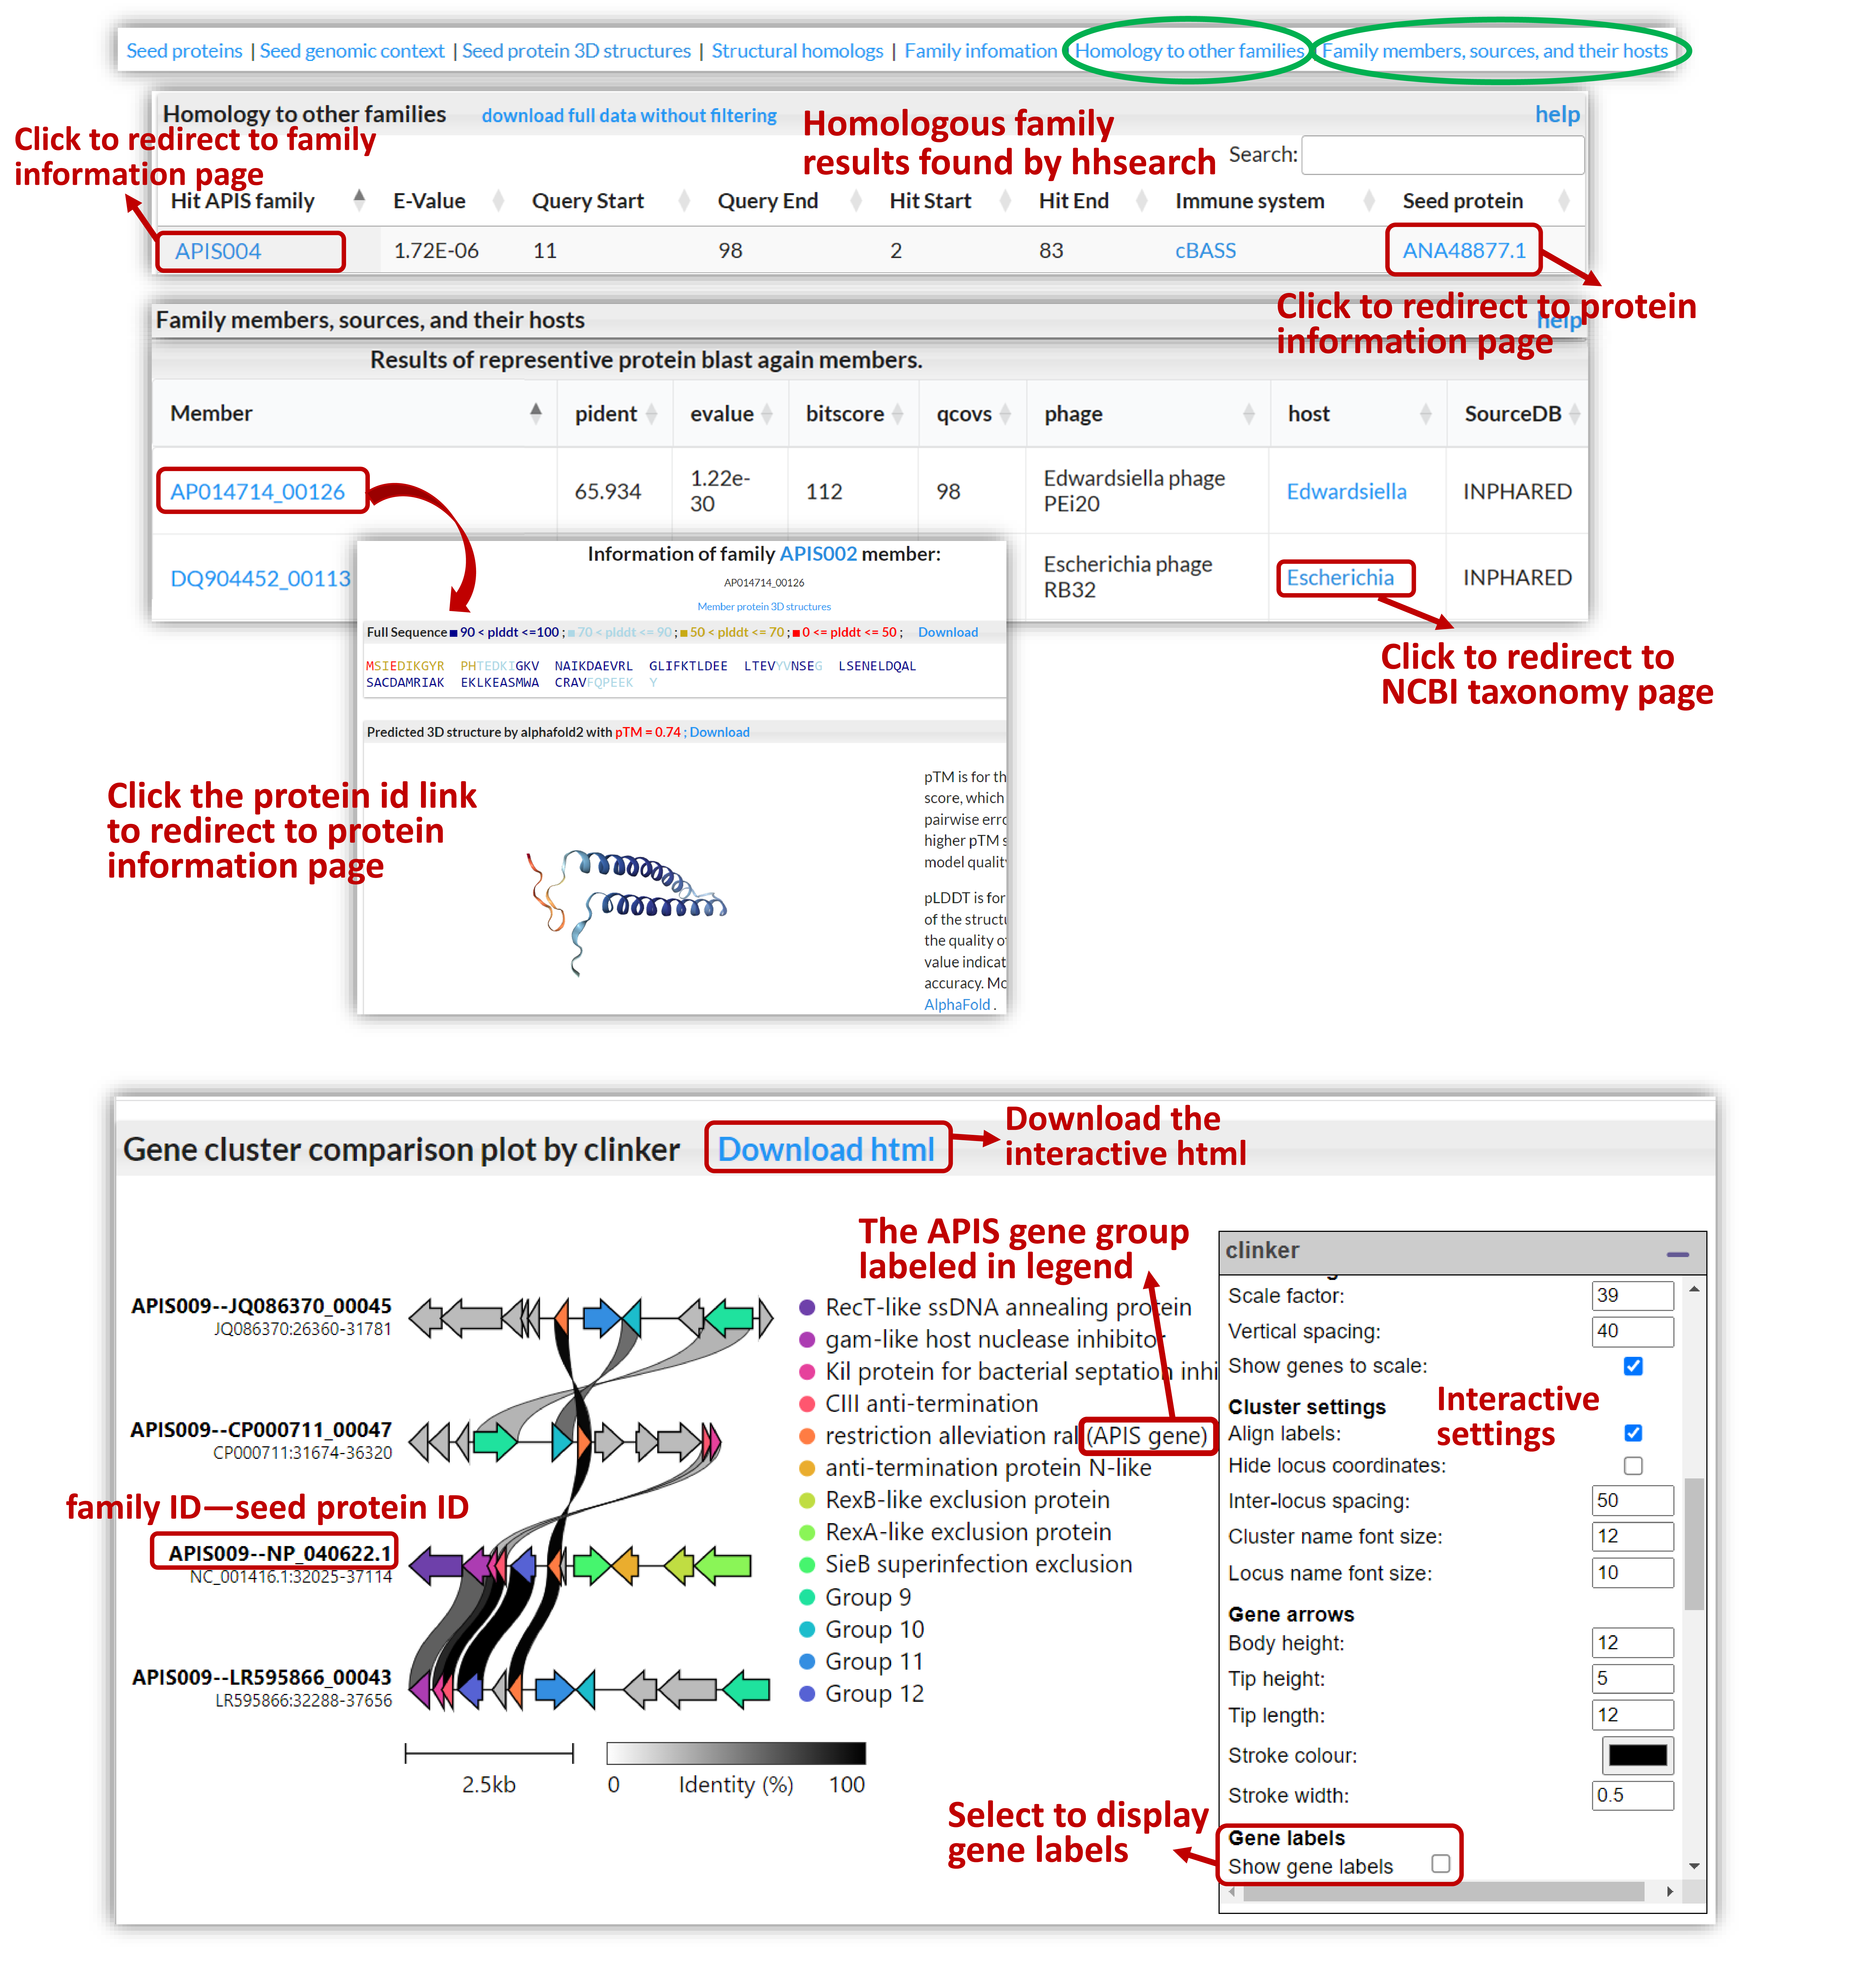
We search families against each other to find distant homologs using HHsearch. HHsearch is a function integrated in HH-suite software package for sensitive protein sequence searching based on the pairwise alignment of hidden Markov models (HMMs). The family homolog table listed families that share similarity.
For members in each family, we provide the BLASTP results of the representative protein against each member, along with the corresponding host, source database, Pfam and PHROG annotation. By clicking on the protein ID, you'll be redirected to protein page that contains AlphaFold predicted structure information.
We also generated the gene cluster (five upstream and five downstream genes of the member protein) comparison plot using Clinker . Such plot is interactive, customizable, and very valuable for users to visualize the genomic context conservation among the member proteins of the family. Some families and family members are not shown in this part due to genomic context data incompleteness.