There are several ways to browse through the available 602 PULs and reach the annotation page for each individual PUL:
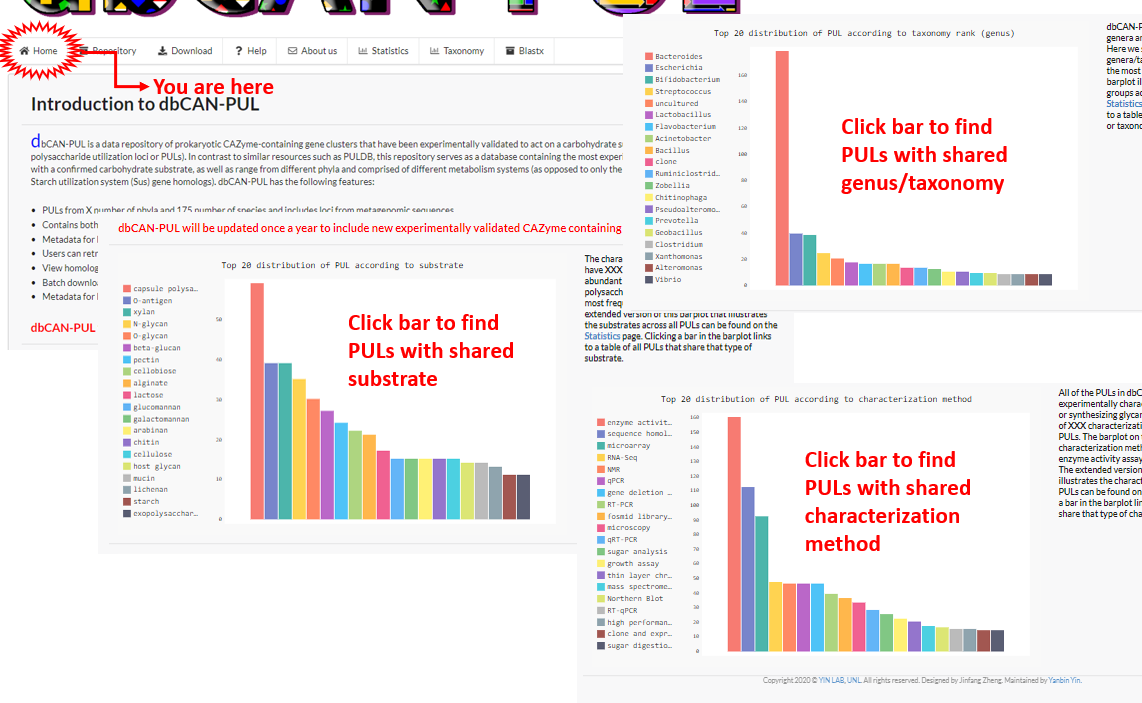
Welcome to dbCAN-PUL! The Home page features three barplots with the number of PULs of a particular (i) substrate, (ii) genus, or (iii) characterization method. The barplots on the Home page only feature the top 20 most frequent instances.
Expanded barplots showing all possible instances of substrates, genera or characterization methods can be viewed at the Statistics page.
Users can click on a bar from any graph and be redirected to the Repository page with PULs filtered with the matching term.
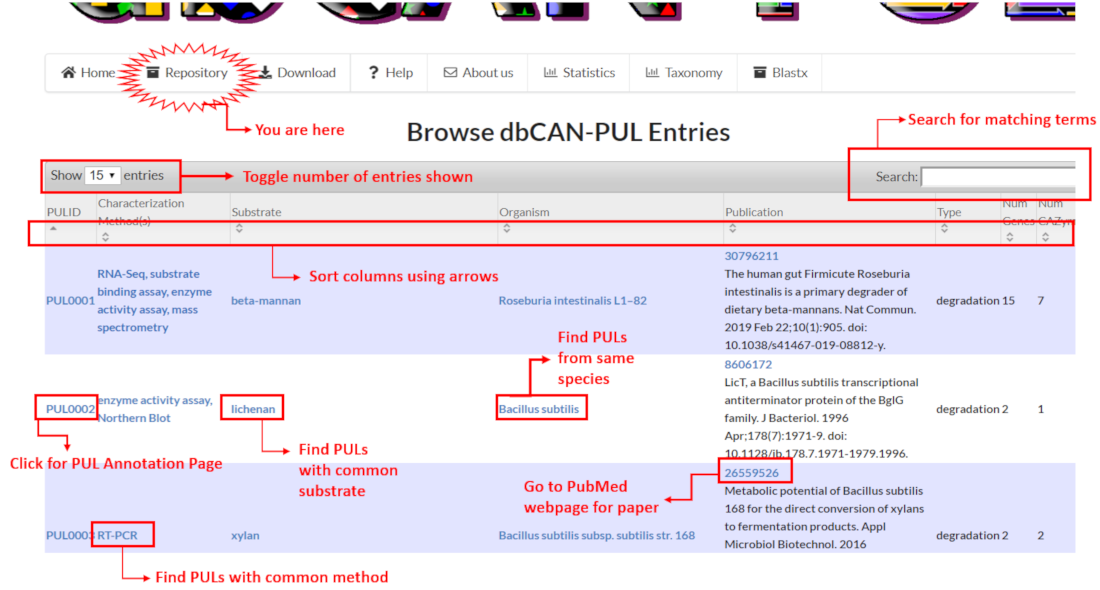
The Repository page displays an interactive table of all PUL entries in dbCAN-PUL. Users can access the annotation page for an individual PUL by clicking the PULID in the "PULID" column.
By using the column headers of the displayed table, users can sort in ascending or descending order the assigned database ID (known as the "PULID"), experimental characterization method, target substrate, binomial organism name, PubMed ID, type (degrading or synthesizing), the number of genes in the PUL and the number of CAZymes in the PUL.
Clicking on blue text links in the PULID column will redirect users to the PUL Annotation Page for the PUL. Clicking on blue text links in all other columns will redirect users to filtered lists of available PULs that match the given term. For example, clicking xylan in the Substrate column will redirect users to a list of PULs that share xylan as a substrate.
A search box at the upper-right corner of the displayed table also allows users to search for terms (such as specific substrates, organisms, keywords in literature titles etc.) and filter PUL entries in the Repository table.
Users can toggle the number of entries to be viewed at a given time in the display table with the dropdown box in the upper left-hand corner of the displayed table.
Clicking the Download button on the navigation bar redirects users to a directory where all data for PULs available for download as well as additional files. Data for individual PULs is contained in the dbCAN-PUL/ directory.
Data files for each PUL include:
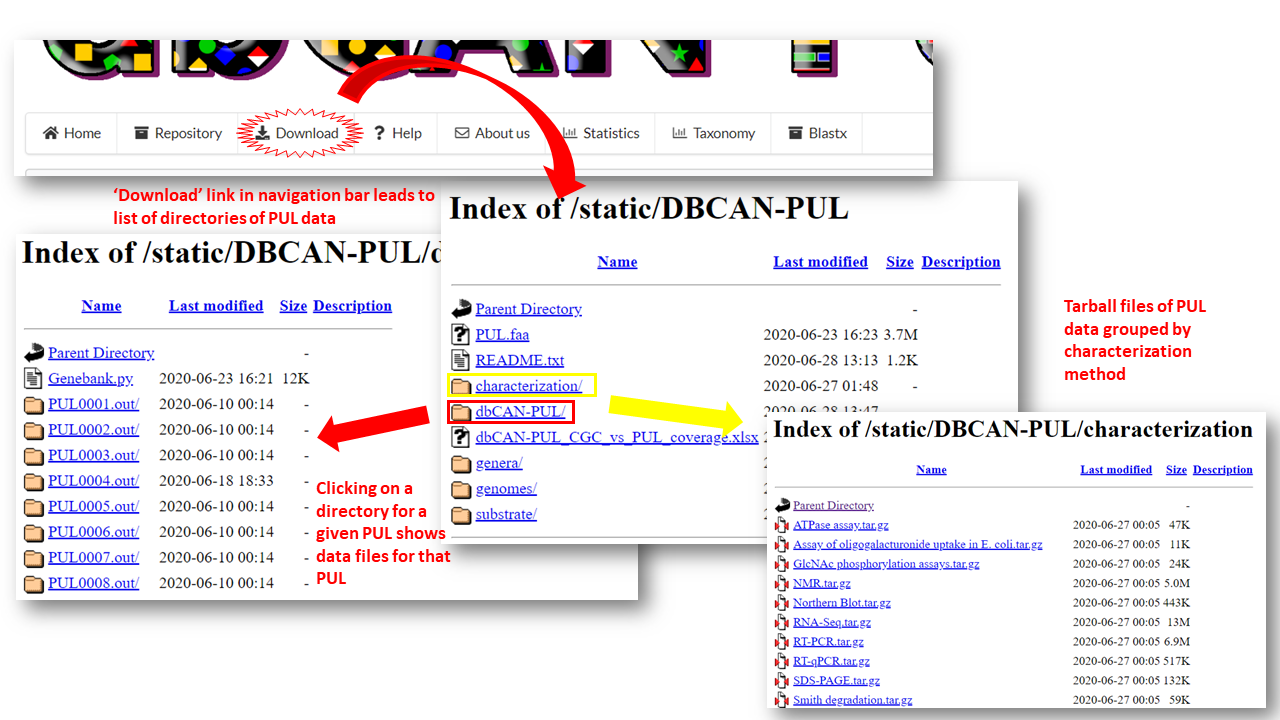
In addition to data for each individual PUL, there are additional files available for download in the main download directory:
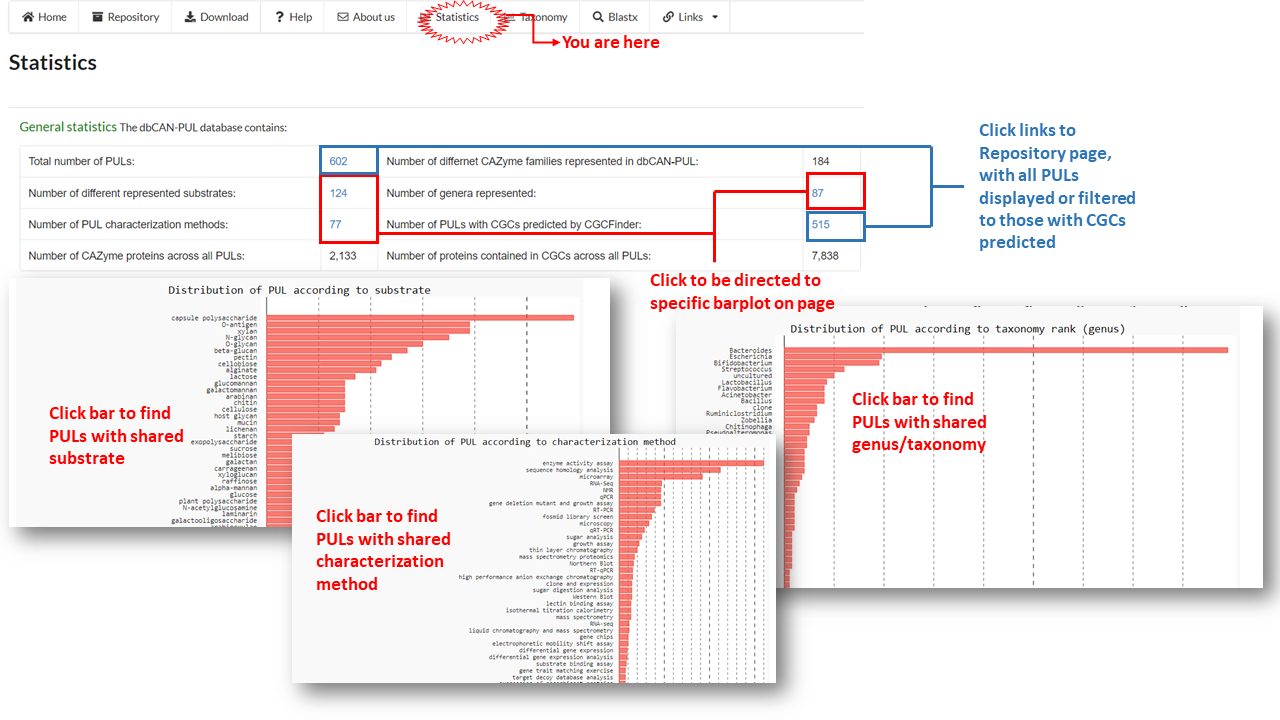
The Statistics page includes extended versions of the barplots featured on the Home page. These barplots visualize the breadth of types of substrates, genera and characterization methods of PULs contained in the database and the number of PULs that fall in a given category.
The barplots can also be used for filtering and viewing PULs by matching substrate, genus or characterization method. Users can click on a bar from any graph and be redirected to the Repository page with PULs filtered with the matching term.
For example, clicking 'qPCR' bar in the characterization method barplot on the statistics page will redirect the user to a list of PULs that share qPCR as a characterization method.
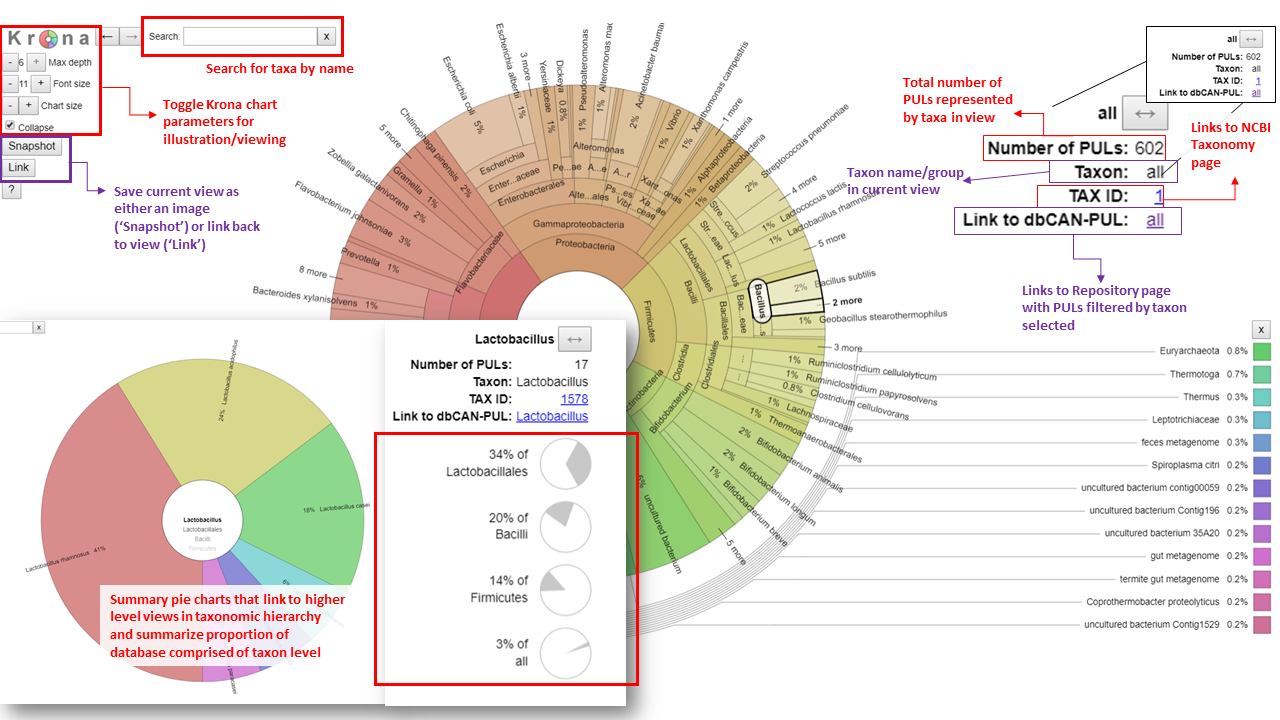
The Taxonomy page displays an interactive Krona diagram that allows for the investigation and visualizion of taxonomic data of PULs in dbCAN-PUL using multi-layered pie charts.
Features of the Krona diagram include:
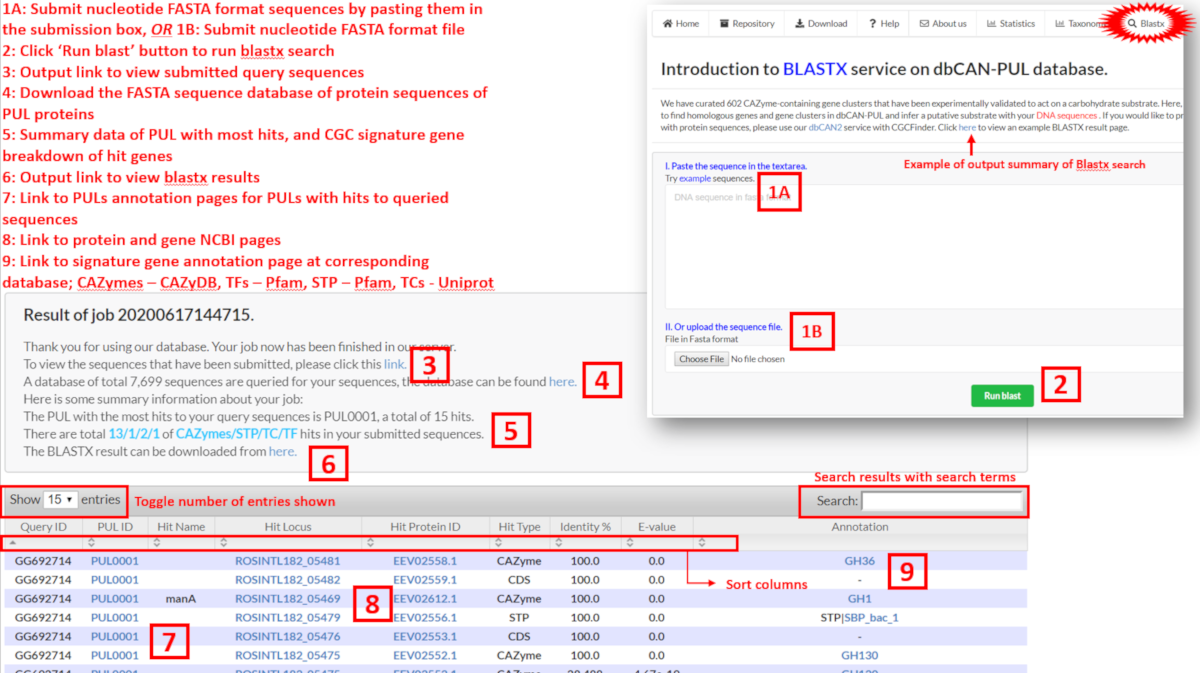
Users can perform a BLASTX search to determine if their own sequences are homologous to sequences and proteins contained in PULs. This can be done in two ways:
Results are then displayed, where users can view which PUL genes have hits and which PUL has the most number of hits to user queried sequences
The PUL Annotation Page for a given PUL displays a variety of information that is presented among different tabs as well as visualized in a graphical gene cluster at the top of the page
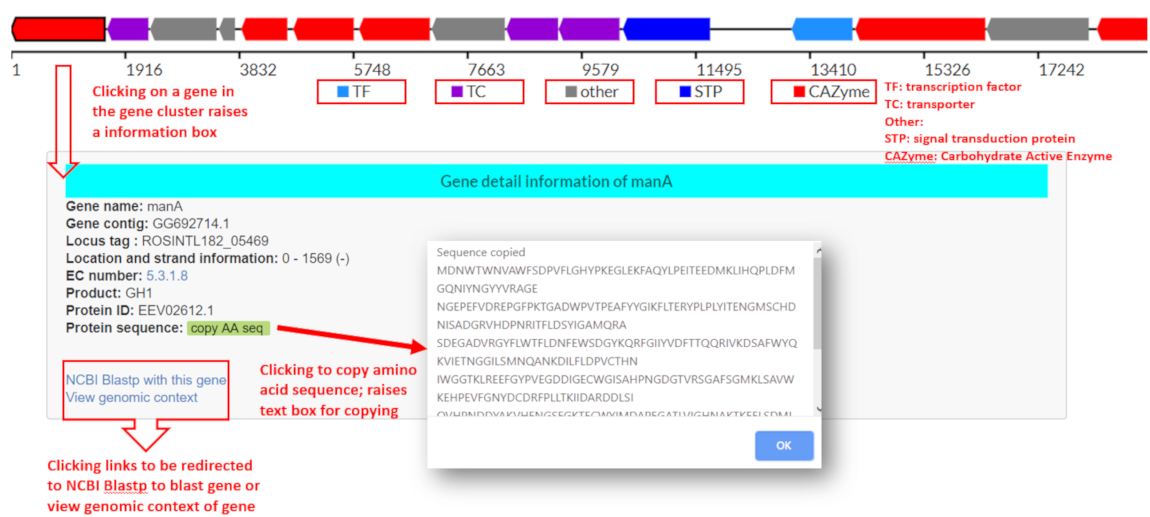
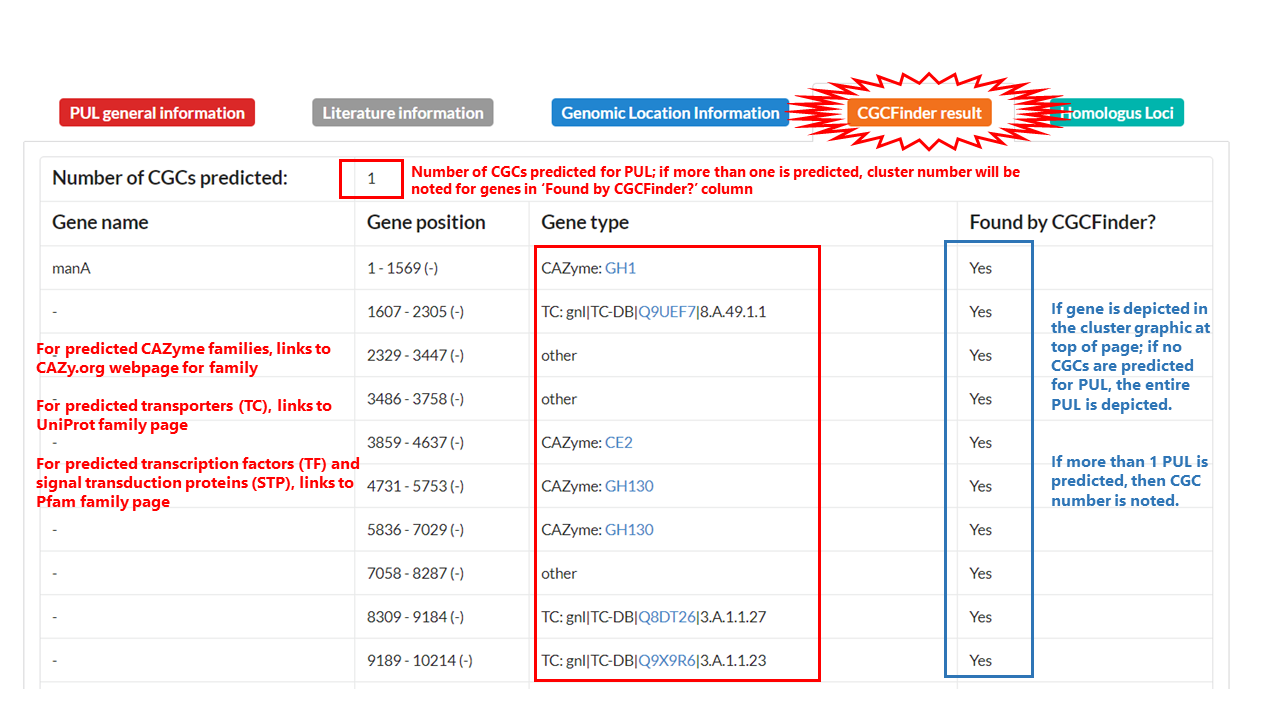
If a PUL is predicted to contain one or more CGCs by CGCFinder, the gene cluster at the top of the page will depict the CGCs predicted. If no CGCs are predicted, all genes of the PUL will be displayed in a gene cluster diagram at the top of the page along with a warning text that no CGC was predicted. The gene cluster diagram will be depicted at the top of the PUL Annotation Page with putative CGC signature genes highlighted by predicted function:
By clicking on each gene, users can view the genomic accession/contig the gene is found on, the genomic location, the product of the gene and protein id if available. Users can copy the amino acid sequence of the protein coding gene as well as query the amino acid sequence using blastp and view the genomic context of the sequence on the genomic accession/contig
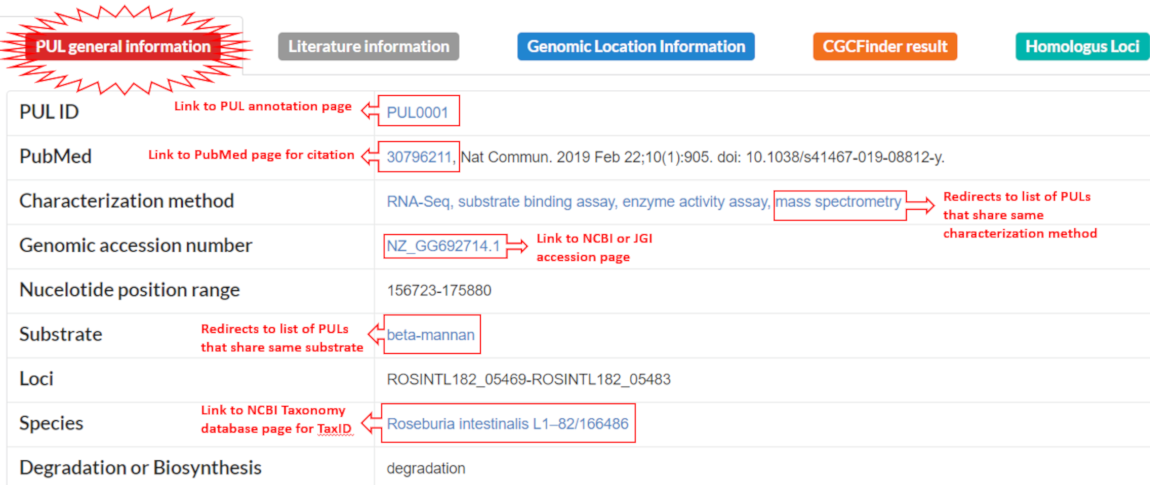
Metadata and general information about the cluster. Clicking the blue text links in certain rows will redirect the users to the following pages:
Introduction: Literature Curation Search
Two rounds of PubMed searches were performed to curate PULs from literature. The two queries were 1) a general query and 2) a query that included specific substrate names:
General query: (oligosaccharide [Title/Abstract] OR polysaccharide [Title/Abstract] OR carbohydrate [Title/Abstract] ) AND (utilization [Title/Abstract] OR degrad* [Title/Abstract] OR catabolism [Title/Abstract] ) AND (cluster [Title/Abstract] OR locus [Title/Abstract] OR loci [Title/Abstract] OR operon [Title/Abstract])
Specific query: {SPECIFIC SUBSTRATE NAME} AND (utilization [Title/Abstract] OR degrad* [Title/Abstract] OR catabolism [Title/Abstract] )AND(cluster [Title/Abstract] OR locus [Title/Abstract] OR loci [Title/Abstract] OR operon [Title/Abstract])
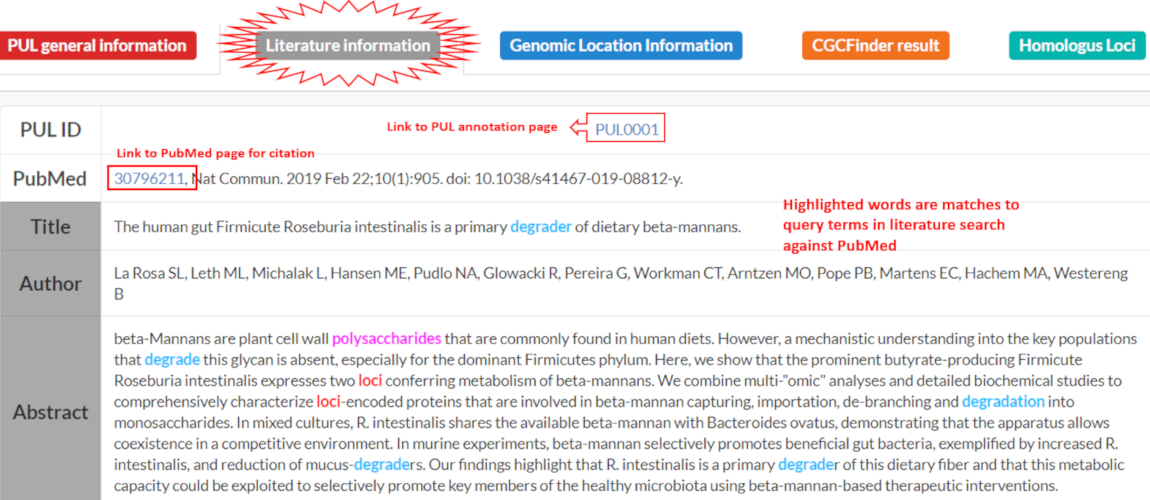
The Literature Information tab displays the citation, authors, title and abstract of the corresponding publication. Key words are highlighted from the search that was performed to curate literature from PULDB
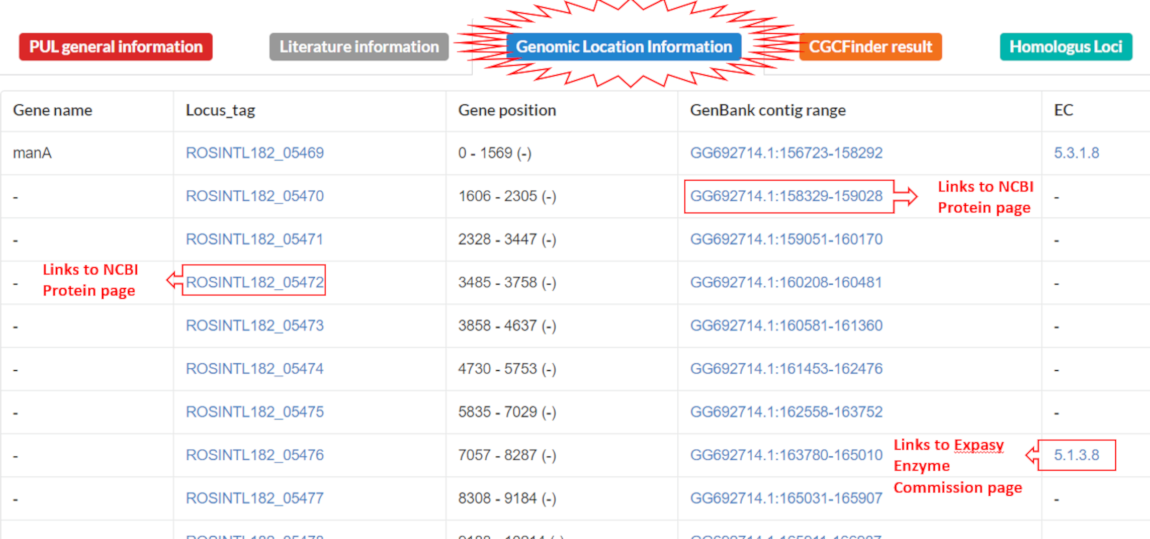
Displays gene names and positions in genomic sequence and annotated Enzyme Commission numbers if available. Clicking blue text links in table redirects users to protein entries and genomic context visualization of a given locus at NCBI.
Introduction: CGCFinder and CGCs
CAZyme Gene Clusters (CGCs) are defined as genomic regions containing at least one CAZyme gene, one transporter/TC gene (predicted by searching against the TCDB), one signal transduction protein/STP (predicted by searching against STP families in Pfam) and one transcription factor/TF gene (predicted by searching against the transcription factor families in Pfam and Superfamily). The rationale is that CAZymes often work together with each other and with other important genes (e.g. TFs, sugar transporters) to synergistically degrade or synthesize various highly complex carbohydrates.
The CGCFinder tool was employed to predict CGCs in PULs derived from literature. We employed more eased settings in this case, with only CAZymes and transporters/TCs being required to predict a CGC, and instances of a CAZymes and TC should not be more than 10 intergenic distances apart.
Gene annotations from dbCAN2 and CGCFinder for CGC predicted genes are depicted in a table. If a gene is predicted to be a CGC signature gene, link to database with extended information about function will be provided via a blue text link in the Gene Type column:
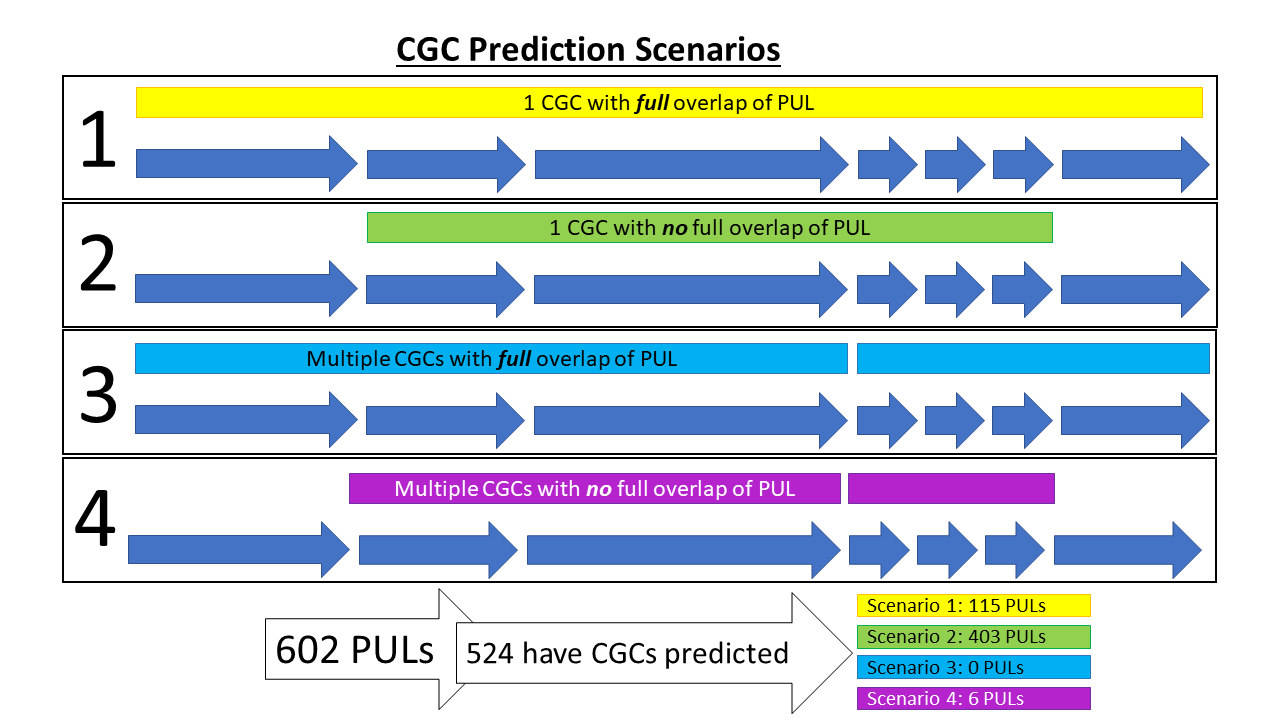
The congruency between CGC prediction and observed PUL genes was assessed. Of the 602 PULs, over 85% (n = 515) had a CGC predicted. In cases where a CGC was not predicted, either other signature genes were not predicted or present, or dbCAN2 tools were unable to predict a CAZyme, perhaps due to novel CAZyme families. Of PULs that had at least one CGC predicted, four possible scenarios of CGC overlap with the PUL was possible (see below). A spreadsheet, dbCAN-PUL_CGC_vs_PUL_coverage.xlsx, listing the PULs of each type of scenario can be found at the Download directory.
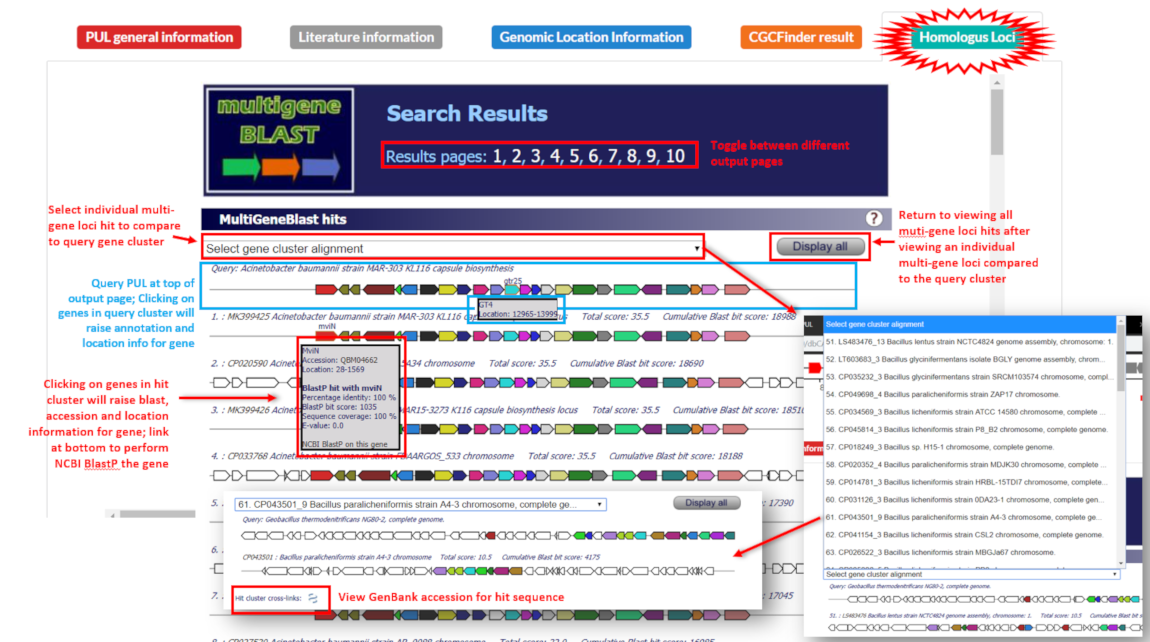
To show homologous multi-gene loci in GenBank sequences, MultiGeneBlast was employed to query PUL protein sequences and visualize matching homologous multi-gene loci.
The MultiGeneBlast displays SVG graphics on interactive HTML pages with the query PUL at the top and genes that have BLAST hits among the subject loci are colored, with matching colors among subject and query loci representing homologous hits. Clicking on any hit gene will allow users to BlastP the protein at NCBI, as well as view NCBI entries for proteins.
Copyright 2020 © YIN LAB, UNL. All rights reserved. Designed by Catie Ausland and Jinfang Zheng. Maintained by Yanbin Yin.